

Snowflake Cost Optimization: 15 proven strategies for reducing costs
Ian Whitestone & Niall WoodwardMonday, February 12, 2024
Snowflake is an incredibly powerful platform, easily scaling to handle ever-larger data volumes without compromising on performance. But, if not controlled, costs associated with this scaling quickly climb. Whether your goal is to reduce the price of an upcoming renewal, extend your existing contract's runway, or reduce on-demand costs, use the strategies in this post to make significant cost savings.
Everything we discuss is based on the real world strategies SELECT has helped over 100 Snowflake customers employ. If you think there's something we've missed, we'd love to hear from you! Reach out via email or use the chat bubble at the bottom of the screen.
This post covers cost optimization techniques, and how you can leverage them to eliminate unnecessary Snowflake credit consumption and free up budget for other workloads. If your goal is making your Snowflake queries run faster, be sure to check out our post on Snowflake query optimization for actionable tips to speed up query execution time.
Before you start
Before you start, it's incredibly important that you first understand your actual Snowflake cost drivers and the Snowflake pricing model. We see many Snowflake customers jump straight into optimizing specific queries or trying to reduce their storage costs, without realizing that those places may not be the problem or best place to start.
As a starting point, we recommend looking at the Snowflake cost management overview in the admin section of the UI and building up an understanding of which services (compute, storage, serverless, etc.) make up the bulk of your costs. For most customers, compute will be the biggest driver (typically over 80% of overall Snowflake costs). Once you've figured this out, your next focus should be understanding which workloads within your virtual warehouses actually make up the bulk of your costs. You can determine this by calculating a cost per query and then aggregating those costs based on query metadata (i.e. query tags or comments).
Cost Optimization Techniques
The cost reduction techniques in this post fall into six broad categories:
1. Virtual warehouse configuration
- Reducing auto-suspend
- Reducing the warehouse size
- Ensure minimum clusters are set to 1
- Consolidate warehouses
2. Workload configuration
- Reducing query frequency
- Only process new or updated data
3. Table configuration
- Ensure your tables are clustered correctly
- Drop unused tables
- Lower data retention
- Use transient tables
5. Data loading patterns
- Avoid frequent DML operations
- Ensure your files are optimally sized before loading
6. Leverage built-in Snowflake controls
- Leverage access control to restrict warehouse usage & modifications
- Enable query timeouts
- Configure Snowflake resource monitors
Let's get straight into it.
1. Reduce auto-suspend to 60 seconds
Use 60 second auto-suspend timeouts for all virtual warehouses. The only place where this recommendation can differ is for user-facing workloads where low latency is paramount, and the warehouse cache is frequently being used. If you’re not sure, go for 60 seconds, and increase it if performance suffers.
Auto-suspend settings have a big impact on the bill because Snowflake charges for every second a Snowflake warehouse is running, with a minimum of 60 seconds. For this reason, we don't recommend setting auto-suspend below 60 seconds, as it can lead to double charges. Auto-suspend settings over 60 seconds result in virtual warehouses being billable while processing no queries. By default, all virtual warehouses created via the user interface have auto-suspend periods of 5 minutes, so be careful when creating new warehouses, too.
Each time a Snowflake virtual warehouse resumes, you are charged for a minimum of 1 minute. After that period, you are charged per second. While it is technically possible to set the auto suspend value lower than 60s (you can put 0s if you want!), Snowflake will only shut it down after 30 seconds of inactivity.
Because of the minimum 1 minute billing period, it's possible for users to get double charged if the auto-suspend is set to 30s. Here's an example:
- A query comes in and runs for 1s
- The warehouse shuts down after 30s
- Another query comes in right after it shuts down and wakes up the warehouse, runs for 1s
- The warehouse shuts down again after 30s
Despite only being up for ~1 minute, the user will actually be charged for 2 minutes of compute in this scenario since the warehouse has resumed twice and you are charged for a minimum of 1 minute each time it resumes.
2. Reduce virtual warehouse size
Virtual warehouse computation resources and cost scale exponentially. Here’s a quick reminder, with compute costs displayed per hour as credits (dollars) assuming a typical rate of $2.5 per credit.
| Warehouse Size | Hourly virtual warehouse pricing |
|---|---|
| X-Small | 1 ($2.50) |
| Small | 2 ($5) |
| Medium | 4 ($10) |
| Large | 8 ($20) |
| X-Large | 16 ($40) |
| 2X-Large | 32 ($80) |
| 3X-Large | 64 ($160) |
| 4X-Large | 128 ($320) |
| 5X-Large | 256 ($640) |
| 6X-Large | 512 ($1280) |
Here’s the monthly pricing for each warehouse assuming running continuously (though not typically how warehouses run due to auto-suspend, it gives a better sense of cost than hourly):
| Warehouse Size | Hourly virtual warehouse pricing |
|---|---|
| X-Small | 720 ($1,800) |
| Small | 1,440 ($3,600) |
| Medium | 2,880 ($7,200) |
| Large | 5,760 ($14,400) |
| X-Large | 11,520 ($28,800) |
| 2X-Large | 23,040 ($57,600) |
| 3X-Large | 46,080 ($115,200) |
| 4X-Large | 92,160 ($230,400) |
| 5X-Large | 184,320 ($460,800) |
| 6X-Large | 368,640 ($921,600) |
Over-sized warehouses can sometimes make up the majority of Snowflake usage. Reduce warehouse sizes and observe the impact on workloads. If performance is still acceptable, try reducing size again. Check out our full guide to choosing the right warehouse size in Snowflake, which includes practical heuristics you can use to identify oversized warehouses.
Example of reducing the warehouse size:
As a quick practical example, consider a data loading job that loads ten files every hour on a Small size warehouse. A small size warehouse has 2 nodes and a total of 16 cores available for processing. This job can at most saturate 10 out of the 16 cores (1 file per core), meaning this warehouse will not be fully utilized. It would be significantly more cost effective to run this job on an X-Small warehouse.
3. Ensure minimum clusters are set to 1
Snowflake Enterprise editions or higher provide multi-cluster warehousing, allowing warehouses to add additional clusters in parallel to handle increased demand. The minimum cluster count setting should always be set to 1 to avoid over-provisioning. Snowflake will automatically add clusters up to the maximum cluster count with minimal provisioning time, as needed. Minimum cluster counts higher than 1 lead to unused and billable clusters.
4. Consolidate warehouses
A big problem we see with many Snowflake customers is warehouse sprawl. When there are too many warehouses, many of them will not be fully saturated with queries and they will sit idle, resulting in unnecessary credit consumption.
Here's an example of the warehouses in our own Snowflake account, visualized in the SELECT product. We calculate & surface a custom metric called warehouse utilization efficiency, which looks at the % of time the warehouse is active and processing queries. Looking at the SELECT_BACKEND_LARGE warehouse in the second row, this warehouse has a low utilization efficiency of 11%, meaning that 89% of the time we are paying for it, it is sitting idle and not processing any queries. There are several other warehouses with low efficiency as well.
The best way to ensure virtual warehouses are being utilized efficiently is to use as few as possible. Where needed, create separate warehouses based on performance requirements versus domains of workload.
For example, creating one warehouse for all data loading, one for transformations, and one for live BI querying will lead to better cost efficiency than one warehouse for marketing data and one for finance data. All data-loading workloads typically have the same performance requirements (tolerate some queueing) and can often share a multi-cluster X-Small warehouse. In contrast, all live, user-facing queries may benefit from a larger warehouse to reduce latency.
Where workloads within each category (loading, transformation, live querying, etc.) need a larger warehouse size for acceptable query speeds, create a new larger warehouse just for those. For best cost efficiency, queries should always run on the smallest warehouse they perform sufficiently quickly on.
5. Reduce query frequency
At many organizations, batch data transformation jobs often run hourly by default. But do downstream use cases need such low latency? Here are some examples of how reducing run frequency can have an immediate impact on cost. In this example, we assume all workloads are non-incremental and so perform a full data refresh each run, and that the initial cost of running hourly was $100,000.
| Run frequency | Annual Cost | Saving |
|---|---|---|
| Hourly | $100,000 | $0 |
| Hourly on weekdays, daily at the weekend | $75,000 | $75,000 |
| Hourly during working hours | $50,000 | $50,000 |
| Once at the start of the working day, once around midday | $8,000 | $92,000 |
| Daily | $4,000 | $96,000 |
6. Only process new or updated data
Significant volumes of data are often immutable, meaning they don’t change once created. Examples of these include web and shipment events. Some do change, but rarely beyond a certain time interval, such as orders which are unlikely to be altered beyond a month after purchase.
Rather than reprocessing all data in every batch data transformation job, incrementalization can be used to filter for only records which are new or updated within a certain time window, perform the transformations, and then insert or update that data into the final table.
For a year-old events table, the impact of switching to incremental, insert-only transformations for new records only could reduce costs by 99%. For a year-old orders table, re-processing and updating only the last month’s and new orders could reduce costs by 90% compared with full refreshes.
Here's an example of the cost reduction we achieved by converting one of our data models to only process new data:
7. Ensure tables are clustered correctly
One of the most important query optimization techniques is query pruning: a technique to reduce the number of micro-partitions scanned when executing a query. Reading micro-partitions is one of the most expensive steps in a query, since it involves reading data remotely over the network. If a filter is applied in a where clause, join, or subquery, Snowflake will attempt to eliminate any micro-partitions it knows don’t contain relevant data. For this to work, the micro-partitions have to contain a narrow range of values for the column you're filtering on.
In order for query pruning to be possible, the table in Snowflake needs to be clustered correctly based on the query access patterns. Consider an orders table, where users frequently filter for orders created after (created_at) a certain date. A table like this should be clustered by created_at.
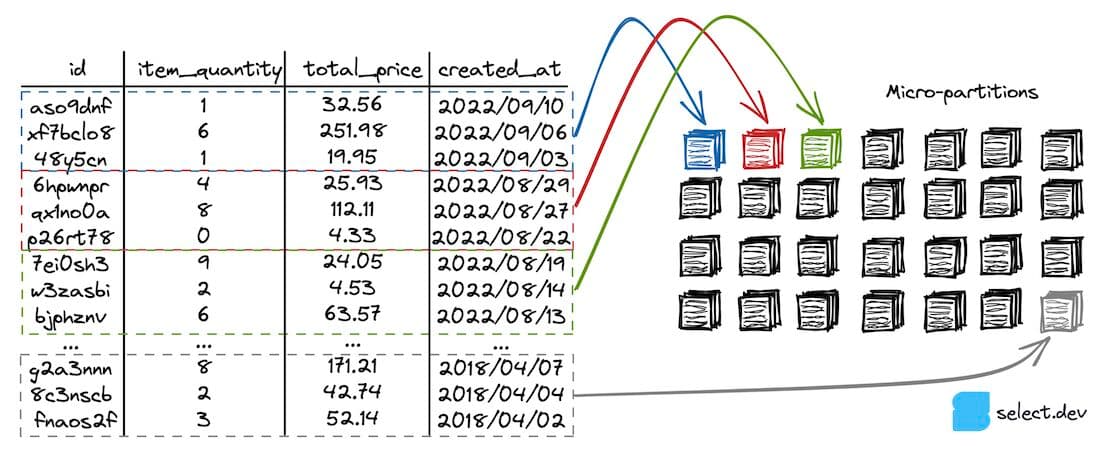
When a user runs the query below against the orders table, query pruning can eliminate most of the micro-partitions from being scanned, which greatly reduces query runtime and therefore results in lower costs.
8. Drop unused tables
While typically only a small (<20%) component of the overall Snowflake costs, unused tables and time-travel backups can eat away at your Snowflake credits. We've previously written about how users can identify unused tables if they are on Snowflake Enterprise edition or higher. If not, use the TABLE_STORAGE_METRICS view to rank order by TOTAL_BILLABLE_BYTES to find the tables with the highest storage costs.
9. Lower data retention
As discussed in our post on Snowflake storage costs, the time travel (data retention) setting can result in added costs since it must maintain copies of all modifications and changes to a table made over the retention period. All Snowflake users should question whether they need to be able to access a historical version of their tables. And if this is needed, how many days of history do you need to retain.
To lower the data retention period for a specific table, you can run the query below:
Or to make the change account wide, run:
10. Use transient tables
Fail safe storage is another source of storage costs that can add up, particularly for tables with lots of churn (more on this below).
If your tables are regularly deleted and re-created as part of some ETL process, or if you have a separate copy of the data available in cloud storage, then there is no need for backing up their data in most cases. By changing a table from permanent to transient, you can avoid spending unnecessarily on Fail Safe and Time Travel backups.
11. Avoid frequent DML operations
A well known anti-pattern in Snowflake is treating it like an operational database where you frequently update, insert, or delete a small number of records.
Why should this be avoided? For two reasons:
- Snowflake tables are stored in immutable micro-partitions, which Snowflake aims to keep around 16MB compressed. A single micro-partition can therefore contain hundreds of thousands of records. Each time you update or delete a single record, Snowflake must re-create the entire micro-partition. This means that updating a single record can mean updating hundreds of thousands of records.
insertscan also be affected by this due to a process known as small file compaction, where Snowflake will instead try and combine new records with existing micro-partitions instead of creating a new one with only a few records. - For the time travel & fail safe storage features, Snowflake must keep copies of all versions of a table. If micro-partitions are frequently being re-created, the amount of storage will increase significantly. For tables with high churn (frequent updates), the time travel and fail safe storage can often become greater than the active storage of the table itself. You can read about the life cycle of a Snowflake table for more details on this topic.
12. Ensure files are optimally sized
To ensure cost effective data loading, a best practice is to keep your files around 100-250MB. To demonstrate these effects, consider the image below. If we only have one 1GB file, we will only saturate 1/16 threads on a Small warehouse used for loading.
If you instead split this file into ten files that are 100 MB each, you will utilize 10 threads out of 16. This level parallelization is much better as it leads to better utilisation of the given compute resources (although it's worth noting that an X-Small would still be the better choice in this scenario).
Have too many small files can also lead to excessive costs if you are using Snowpipe for data loading, since Snowflake charges an overhead fee of 0.06 credits per 1000 files loaded.
13. Leverage access control
Access control is a powerful technique for controlling costs that many Snowflake customers don't think of. By restricting who can make changes to virtual warehouses, you will minimize the chances of someone accidentally making an unintended resource modification that leads to unexpected costs. We've seen many scenarios where someone increases a virtual warehouse size and then forgets to change it back. By implementing stricter access control, companies can ensure that resource modifications go through a controlled process and minimize the chance of unintended changes being made.
You can also use access control to limit which users can run queries on certain warehouses. By only allowing users to use smaller warehouses, you will force them to write more efficient queries rather than defaulting to running on a larger warehouse size. When required, there can be policies or processes in place to allow certain queries/users to run on a larger warehouse when absolutely necessary.
14. Enable query timeouts
Query timeouts are a setting that prevents Snowflake queries from running for too long, and consequently from costing too much. If a query runs for longer than the timeout setting, the query is automatically cancelled by Snowflake.

Query timeouts are a great way to mitigate the impact of runaway queries. By default, a Snowflake query can run for two days before it is cancelled, racking up significant costs. We recommend you put query timeouts in place on all warehouses to mitigate the maximum cost a single query can incur. See our post on the topic for more advice on how to set these.
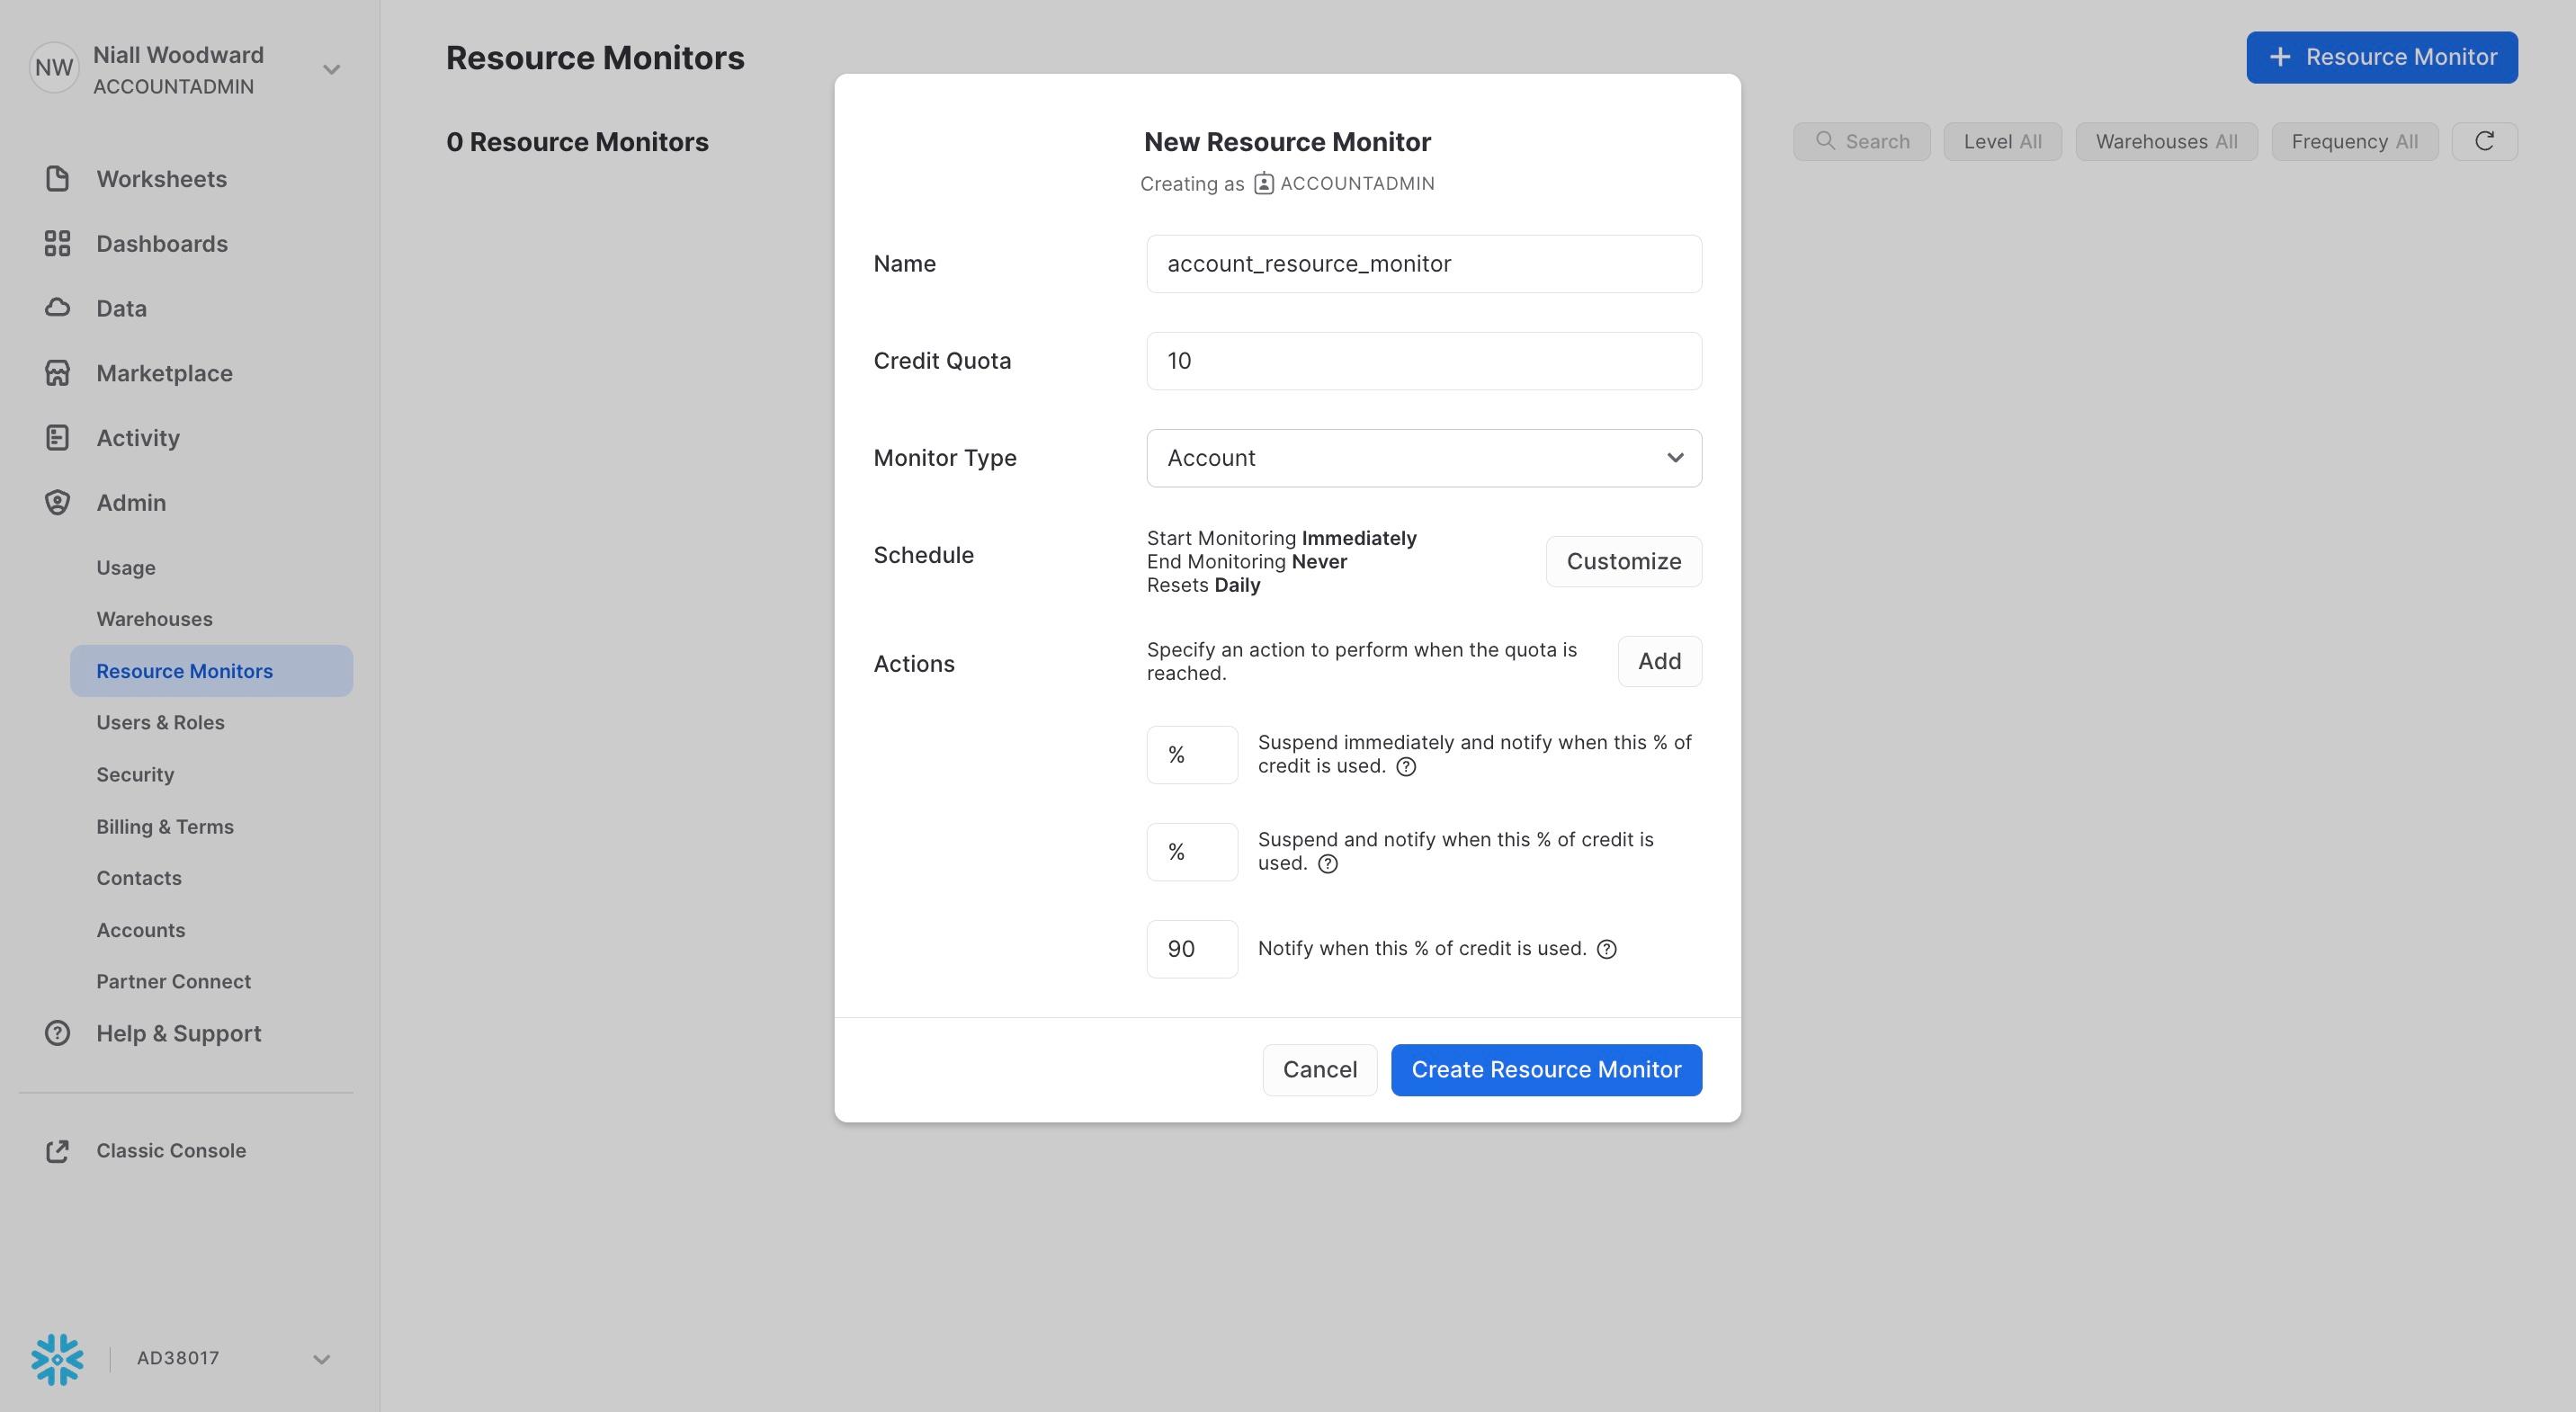
15. Configure resource monitors
Similar to query timeouts, resource monitors allow you to restrict the total cost a given warehouse can incur. You can use resource monitors for two purposes:
- To send you a notification once costs reach a certain threshold
- To restrict a warehouse from costing more than a certain amount in a given time period. Snowflake can prevent queries from running on a warehouse if it has surpassed it's quota.
Resource monitors are a great way to avoid surprises in your bill and prevent unnecessary costs from occuring in the first place.
A final word of advice
There's a great quote from the world of FinOps which is worth sharing:
The greatest cloud savings emerge from costs never born
In this post, we've shared a bunch of ways you can lower your Snowflake costs to meet your cost reduction targets, or free up your budget for new workloads. But, getting to a place where you need these techniques means you have have already incurred these costs and potentially operated in a suboptimal way for an extended period.
One of the best ways to prevent unnecessary costs is to implement an effective cost monitoring strategy from the start. Build your own dashboard on top of the Snowflake account usage views and review it each week, or try out a purpose built cost monitoring product like SELECT. By catching spend issues early, you can prevent unnecessary costs from piling up in the first place.
The Missing Manual: Everything You Need to Know about Snowflake Cost Optimization (April 2023)
If you're looking for a presentation which covers many of the topics discussed in the post, we recommend watching the talk we gave at Data Council in April 2023.
In this talk, we cover everything you need to know about cost and performance optimization in Snowflake. We start with a deep dive into Snowflake’s architecture & billing model, covering key concepts like virtual warehouses, micro-partitioning, the lifecycle of a query and Snowflake’s two-tiered cache. We go in depth on the most important optimization strategies, like virtual warehouse configuration, table clustering and query writing best practices. Throughout the talk, we share code snippets and other resources you can leverage to get the most out of Snowflake.
Recording
A recording of the presentation is available on YouTube.
If you would like, we are more than happy to come in and give this presentation (or a variation of it) to your team where they can have the opportunity to ask questions. Send an email to [email protected] if you would like to set that up.
Slides

Ian is the Co-founder & CEO of SELECT, a SaaS Snowflake cost management and optimization platform. Prior to starting SELECT, Ian spent 6 years leading full stack data science & engineering teams at Shopify and Capital One. At Shopify, Ian led the efforts to optimize their data warehouse and increase cost observability.

Niall is the Co-Founder & CTO of SELECT, a SaaS Snowflake cost management and optimization platform. Prior to starting SELECT, Niall was a data engineer at Brooklyn Data Company and several startups. As an open-source enthusiast, he's also a maintainer of SQLFluff, and creator of three dbt packages: dbt_artifacts, dbt_snowflake_monitoring and dbt_query_tags.
Want to hear about our latest data cloud learnings?Subscribe to get notified.
Get up and running in less than 15 minutes
Connect your Snowflake, Databricks, or BigQuery account and instantly understand your savings potential.

