

Calculating cost per query in Snowflake
Ian WhitestoneSunday, April 14, 2024
For most Snowflake customers, compute costs (the charges for virtual warehouses), will make up the largest portion of the bill. To effectively reduce this spend and manage costs, high-cost queries need to be accurately identified.
Snowflake customers are billed 1 for each second that virtual warehouses are running, with a minimum 60-second charge each time one is resumed. The Snowflake UI currently provides a breakdown of cost per virtual warehouse, but doesn't attribute spend at a more granular, per-query level. This post provides a detailed overview and comparison of different ways to attribute warehouse costs to queries, along with the code required to do so.
If you want to skip ahead and see the SQL implementation for the recommended approach, you can head straight to the end!
Simple approach
We'll start with a simple approach that multiplies a query's execution time with the billing rate for the warehouse it ran on. For example, say a query ran for 10 minutes on a medium size warehouse. A medium warehouse costs 4 credits per hour, and with a cost of $3 per credit
2, we'd say this query costs $2 (10/60 hours * 4 credits / hour * $3/credit).
SQL Implementation
We can implement this in SQL by leveraging the snowflake.account_usage.query_history view which contains all queries from the last year along with key metadata like the total execution time and size of the warehouse the query ran on:
This gives us an estimated query cost for each query_id. To account for the same query being run multiple times in a period, we can aggregate by the query_text:
Opportunities for improvement
While simple and easy to understand, the main pitfall with this approach is that Snowflake does not charge per second a query ran. They charge per second the warehouse is up. A given query may automatically resume the warehouse, run for 6 seconds, then cause the warehouse to idle before being automatically suspended. Snowflake bills for this idle time, and therefore it can be helpful to "charge back" this cost to the query. Similarly, if two queries run concurrently on the warehouse for the same 20 minutes, Snowflake will bill for 20 minutes, not 40. Idle time and concurrency are therefore important considerations in cost attribution and optimization efforts.
When aggregating by query_text to get total cost in the period, we grouped by the un-processed query text. In practice, it is common for the systems that created these queries to add unique metadata into each query. For example, Looker will add some context to each query. The first time a query is run, it may look like this:
And in the next run, this metadata will be different:
Similar to Looker, dbt will add its own metadata, giving each query a unique invocation_id:
When grouped by query_text, the two occurrences of the query above won't be linked since this metadata makes each one unique. This could result in a single and potentially easily addressed source of high cost queries (for example a dashboard) going unidentified.
We may wish to go even further and bucket costs at a higher level. dbt models often consist of multiple queries being run: a CREATE TEMPORARY TABLE followed by a MERGE statement. A given dashboard may trigger 5 different queries each time it is refreshed. Being able to group the entire collection of queries from a single origin is very useful for attributing spend and then targeting improvements in a time efficient manner.
With these opportunities in mind, can we do better?
New approach
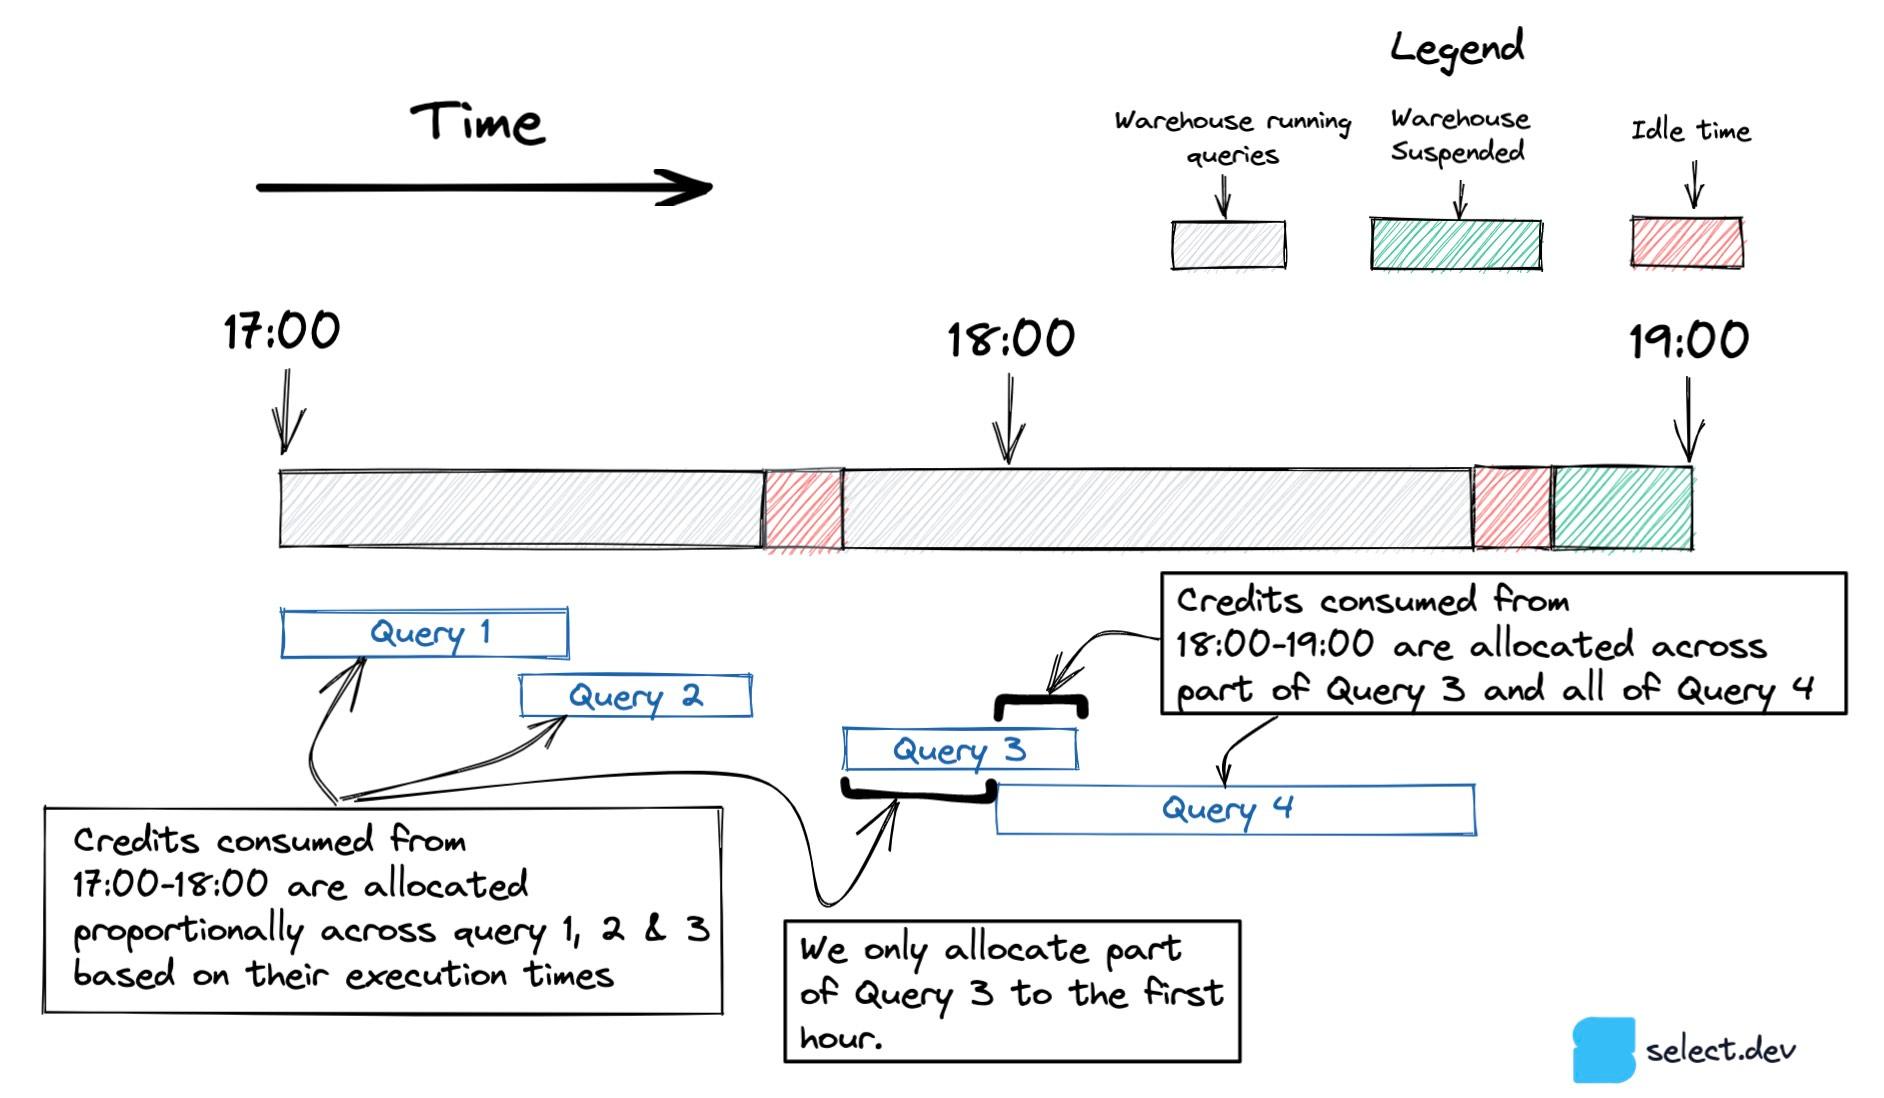
To be able to reconcile the total attributed query costs with the final bill, it's important to start with the exact charges for each warehouse. The decision to use an hourly granularity comes from snowflake.account_usage.warehouse_metering_history, the source of truth for warehouse charges, which reports credit consumption at an hourly level. We can then calculate how many seconds each query spent executing in the hour, and allocate the credits proportionally to each query based on their fraction of the total execution time. In doing so, we will account for idle time by distributing it among the queries that ran during the period. Concurrency will also be handled since more queries running will generally lower the average cost per query.
To ground this in an example, say the TRANSFORMING_WAREHOUSE consumed 100 credits in a single hour. During that time, three queries ran, 2 for 10 minutes and 1 for 20 minutes, for 40 minutes of total execution time. In this scenario, we would allocate credits to each query in the following way:
- Query 1 (10 minutes) -> 25 credits
- Query 2 (20 minutes) -> 50 credits
- Query 3 (10 minutes) -> 25 credits
In the diagram below, query 3 begins between 17:00-18:00 and finishes after 18:00. To account for queries which span multiple hours, we only include the portion of the query that ran in each hour.
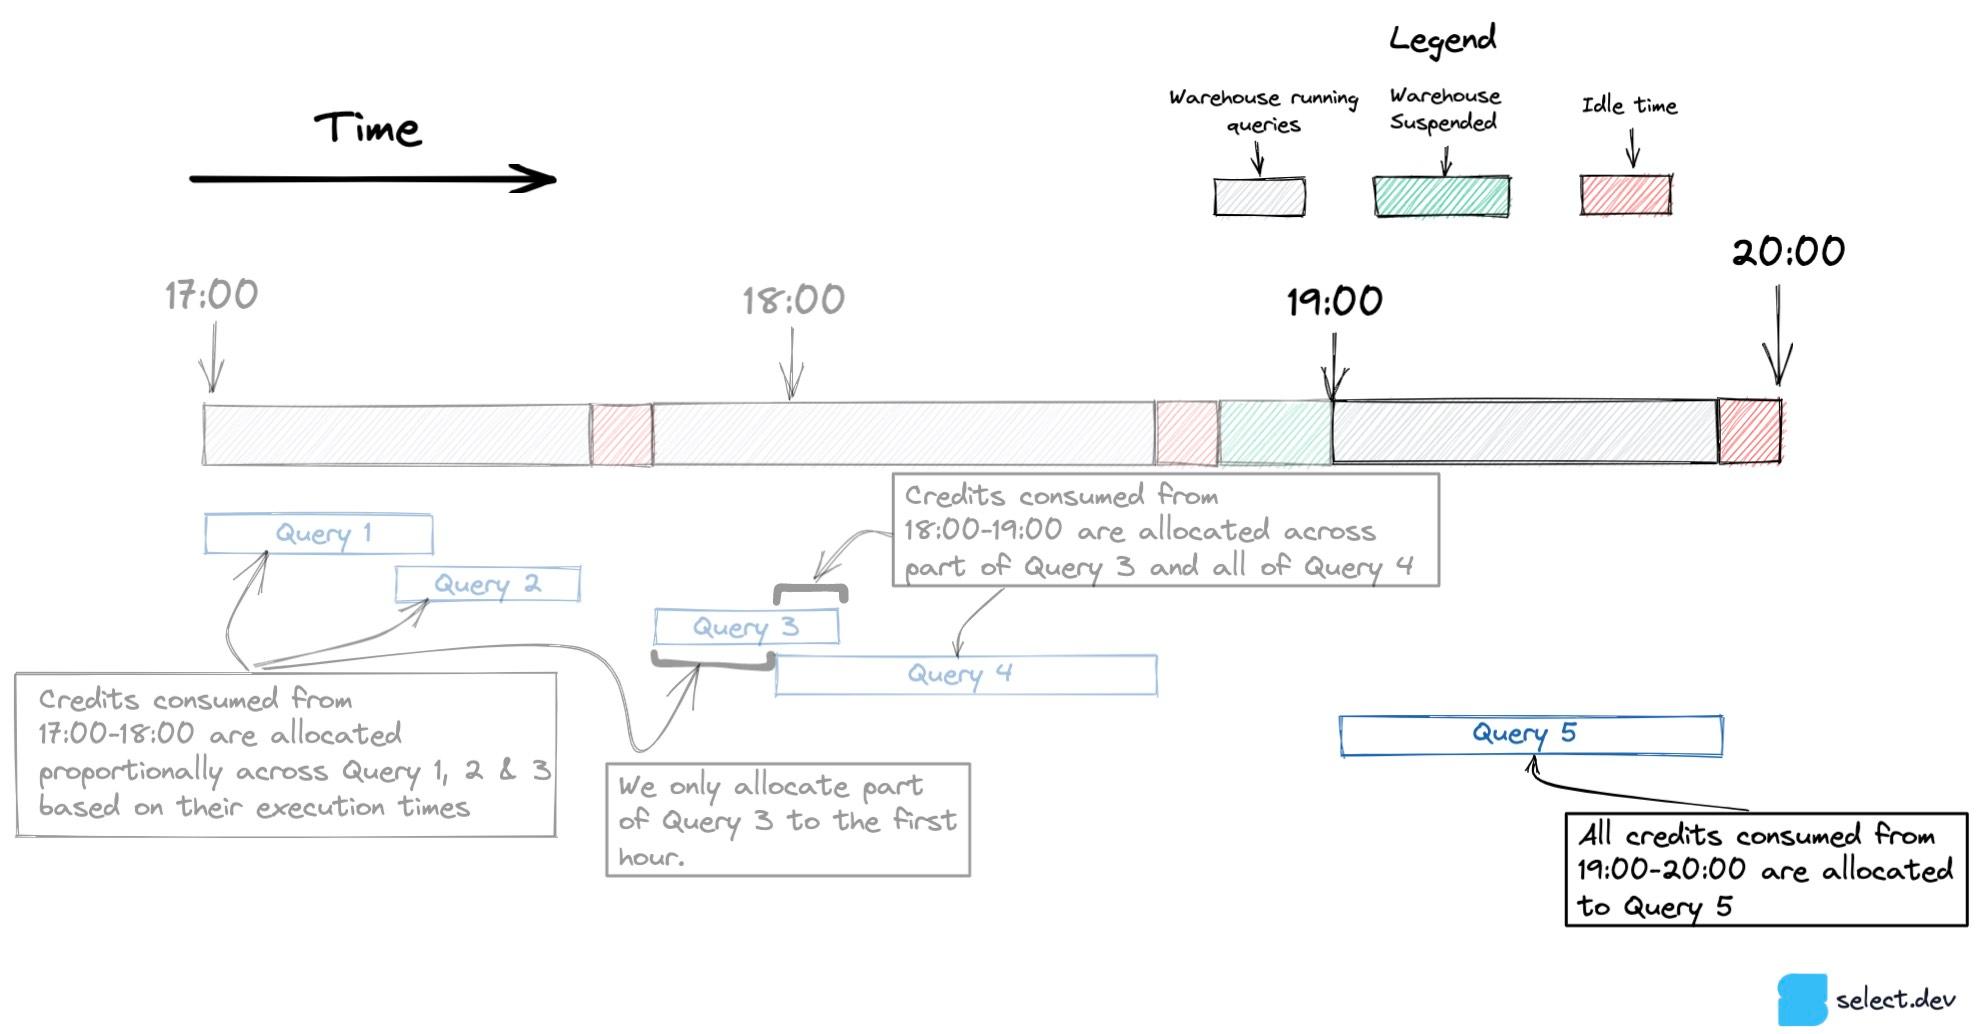
When only one query runs in an hour, like Query 5 below, all credit consumption is attributed to that one query, including the credits consumed by the warehouse sitting idle.
SQL Implementation
Some queries don't execute on a warehouse and are processed entirely by the cloud services layer. To filter those, we remove queries with warehouse_size IS NULL
3. We'll also calculate a new timestamp, execution_start_time, to denote the exact time at which the query began running on the warehouse
4.
Next, we need to determine how long each query ran in each hour. Say we have two queries, one that ran within the hour and one that started in one hour and ended in another.
| query_id | execution_start_time | end_time |
|---|---|---|
| 123 | 2022-10-08 08:27:51.234 | 2022-10-08 08:30:20.812 |
| 456 | 2022-10-08 08:30:11.941 | 2022-10-08 09:01:56.000 |
We need to generate a table with one row per hour that the query ran within.
| query_id | execution_start_time | end_time | hour_start | hour_end |
|---|---|---|---|---|
| 123 | 2022-10-08 08:27:51.234 | 2022-10-08 08:30:20.812 | 2022-10-08 08:00:00.000 | 2022-10-08 09:00:00.000 |
| 456 | 2022-10-08 08:30:11.941 | 2022-10-08 09:01:56.000 | 2022-10-08 08:00:00.000 | 2022-10-08 09:00:00.000 |
| 456 | 2022-10-08 08:30:11.941 | 2022-10-08 09:01:56.000 | 2022-10-08 09:00:00.000 | 2022-10-08 10:00:00.000 |
To accomplish this in SQL, we generate a CTE, hours_list, with 1 row per hour in the 30 day range we are looking at. Then, we perform a range join with the filtered_queries to get a CTE, query_hours, with 1 row for each hour that a query executed within.
Now we can calculate the number of milliseconds each query ran for within each hour along with their fraction relative to all queries by leveraging the DATEDIFF function.
Finally, we get the actual credits used from snowflake.account_usage.warehouse_metering_history and allocate them to each query according to the fraction of all execution time that query contributed. One last aggregation is performed to return the dataset back to one row per query.
Processing the query text
As discussed earlier, many queries will contain custom metadata added as comments, which restrict our ability to group the same queries together. Comments in SQL can come in two forms:
- Single line comments starting with
-- - Single or multi-line comments of the form
/* <comment text> */
Each of these comment types can be removed using Snowflake's REGEXP_REPLACE function5.
Now we can aggregate by cleaned_query_text instead of the original query_text when identifying the most expensive queries in a particular timeframe. To see the final version of the SQL implementation using this cleaned_query_text, head to the appendix.
Opportunities for improvement
While this method is a great improvement over the simple approach, there are still opportunities to make it better. The credits associated with warehouse idle time are distributed across all queries that ran in a given hour. Instead, attributing idle spend only to the query or queries that directly caused it will improve the accuracy of the model, and therefore its effectiveness in guiding cost reduction efforts.
This approach also does not take into account the minimum 60-second billing charge. If there are two queries run separately in a given hour, and one takes 1 second to execute and another takes 60 seconds, the second query will appear 60 times more than expensive than the first query, even though that first query consumes 60 seconds worth of credits.
The query_text processing technique has room for improvement too. It's not uncommon for incremental data models to have hardcoded dates generated into the SQL, which change on each run. For example:
You can also see this behaviour in parameterized dashboard queries. For example, a marketing dashboard may expose a templated query:
Each time this same query is run, it is populated with different values:
While the parameterized queries can be handled with more advanced SQL text processing, idle and minimum billing times are trickier. At the end of the day, the purpose of attributing warehouse costs to queries is to help users determine where they should focus their time. With this current approach, we strongly believe it will let you accomplish this goal. All models are wrong, but some are useful.
Planned future enhancements
In addition to the more advanced SQL text processing discussed above, there are a few other enhancements we plan to make to this approach:
- If cloud service credits exceed 10% of your daily compute credits, Snowflake will begin to charge you for them. To improve the robustness of this model, we need to account for the cloud services credits associated with each query that ran in a warehouse, as well as the queries that did not run in any warehouse. Simple queries like
SHOW TABLESthat only run in cloud services can end up consuming credits if they are executed very frequently. See this post on how Metabase metadata queries were costing $500/month in cloud services credits. - Extend the model to calculate cost per data asset, rather than cost per query. To calculate cost per DBT model, this will involve parsing the dbt JSON metadata automatically injected into each SQL query generated by dbt. It could also involve connecting to BI tool metadata to calculate things like "cost per dashboard".
- We plan to bundle this code into a new dbt package so users can easily get greater visibility into their Snowflake spend
How to identify expensive queries
Once you've calculated the cost per query and stored it in a new table (i.e. query_history_enriched), you can quickly identify the top 100 most expensive queries in your account by running the following query:
Notes
1Snowflake uses the concept of credits for most of its billable services. When warehouses are running, they consume credits. The rate at which credits are consumed doubles each time the warehouse size is increased. An X-Small warehouse costs 1 credit per hour, a small costs 2 credits per hour, a medium costs 4 credits per hour, etc. Each Snowflake customer will pay a fixed rate per credit, which is how the final dollar value on the monthly bill is calculated. ↩
2The cost per credit will vary based on the plan you are on (Standard, Enterprise, Business Critical, etc..) and your contract. On demand customers will generally pay $2/credit for Standard, and $3/credit on Enterprise. If you sign an annual contract with Snowflake, this rate will get discounted based on how many credits you purchase up front. All examples here are in US dollars. ↩
3It is possible for queries to run without a warehouse by leveraging the metadata in cloud services. ↩
4There are a number of things that need to happen before a query can begin executing in a warehouse, such as query compilation in cloud services and warehouse provisioning. In a future post we'll dive deep into the lifecycle of a Snowflake query. ↩
5⚠️, the REGEX '(/\*.*\*/)' won't work for two comments on the same line, such as /* hi */SELECT * FROM table/* hello there */
↩
Appendix
Complete SQL Query
For a Snowflake account with ~9 million queries per month, the query below took 93 seconds on an X-Small warehouse.
Alternative approach considered
Before landing on the final approach presented above, an approach that more accurately handled concurrency and idle time was considered, especially across multi-cluster warehouses. Instead of working from the actual credits charged per hour, this approach leveraged the snowflake.account_usage.warehouse_events_history view to construct a dataset with 1 row per second each warehouse cluster was active. Using this dataset, along with the knowledge of which query ran on which warehouse cluster, it's possible to more accurately attribute credits to each set of queries, as shown in the diagram below.
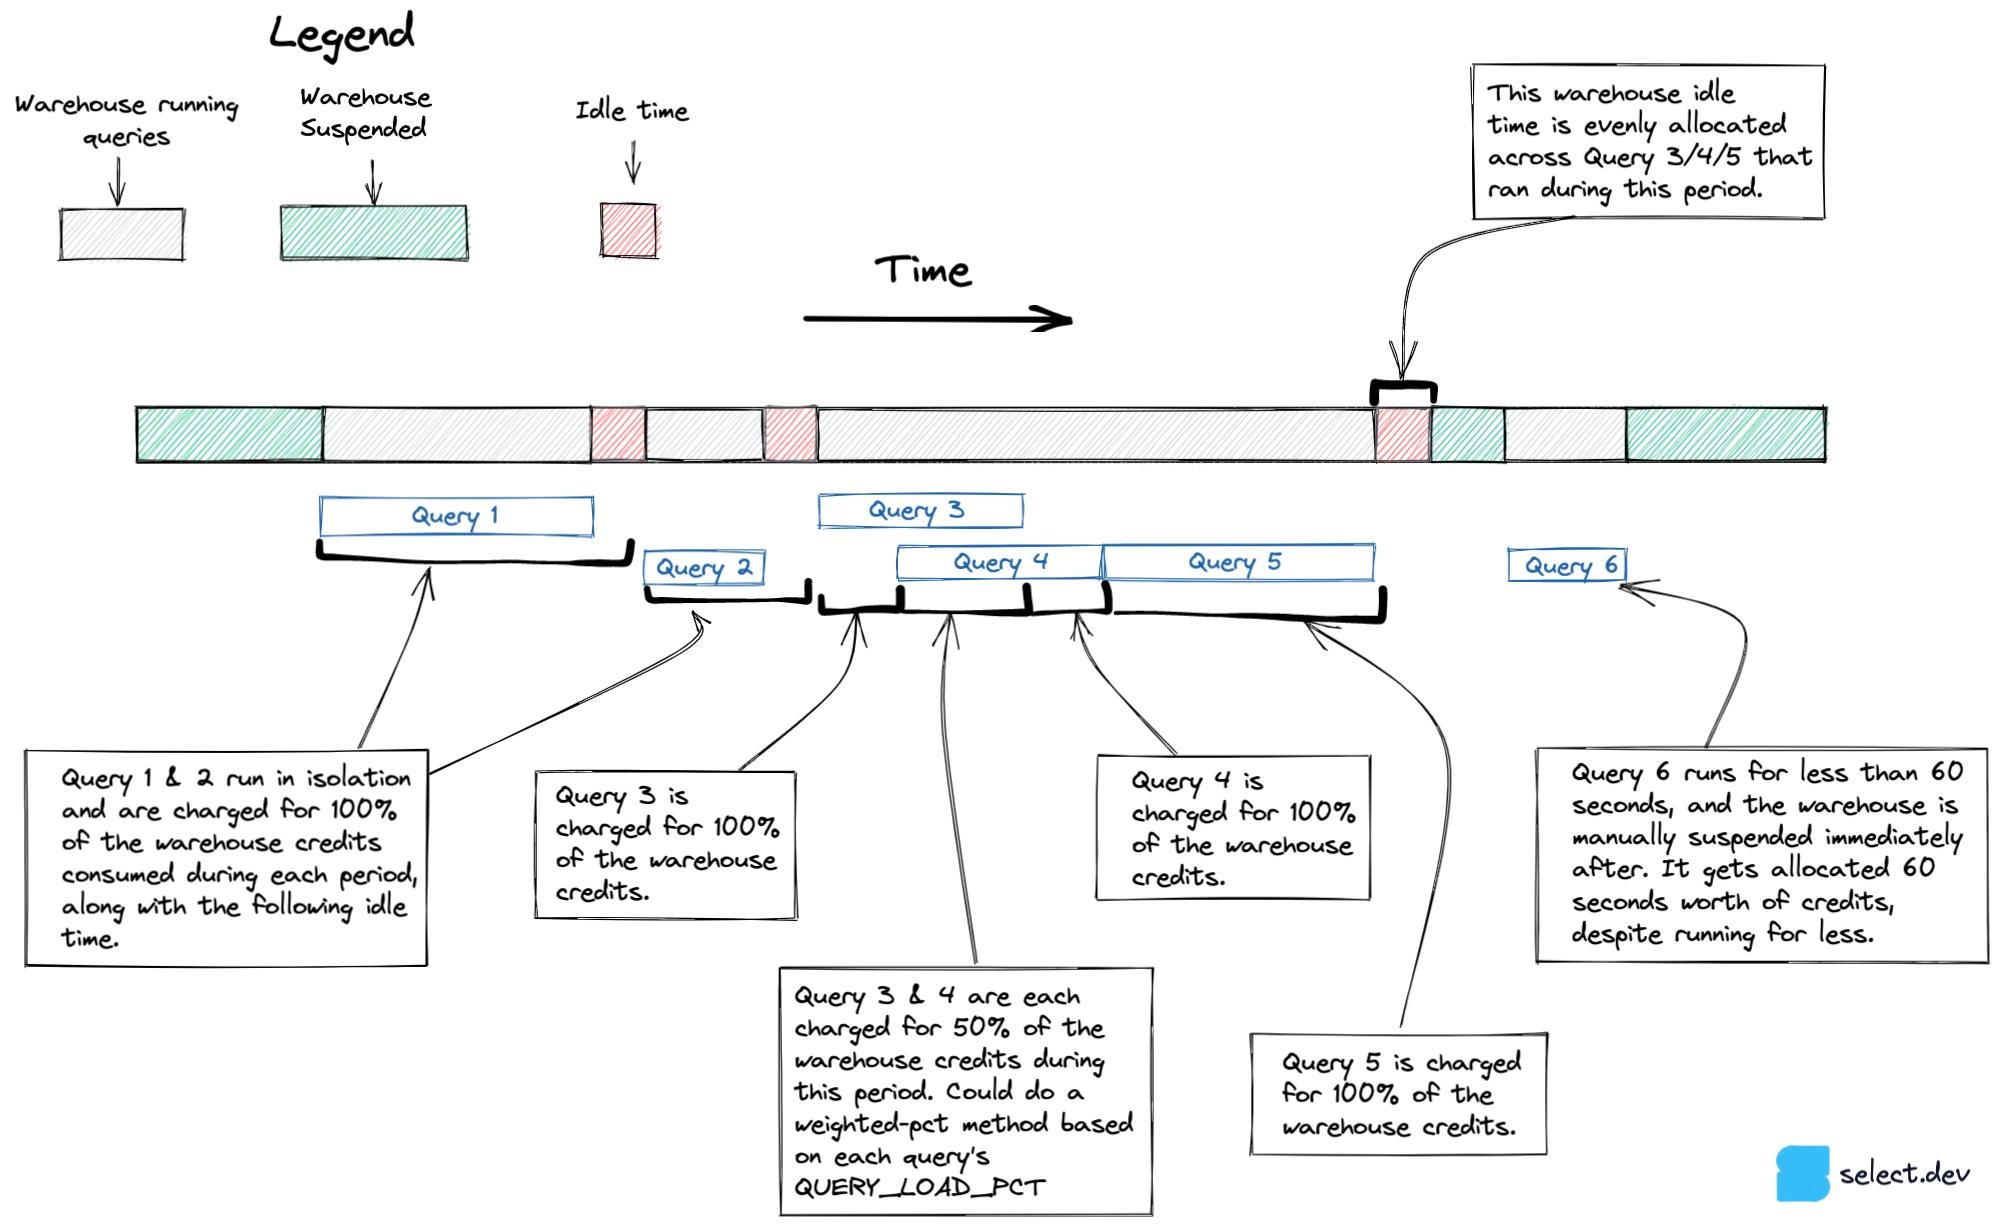
Unfortunately, it was discovered that the warehouse_events_history does not give a perfect representation of when each warehouse cluster was active, so this approach was abandoned.

Ian is the Co-founder & CEO of SELECT, a SaaS Snowflake cost management and optimization platform. Prior to starting SELECT, Ian spent 6 years leading full stack data science & engineering teams at Shopify and Capital One. At Shopify, Ian led the efforts to optimize their data warehouse and increase cost observability.
Want to hear about our latest data cloud learnings?Subscribe to get notified.
Get up and running in less than 15 minutes
Connect your Snowflake, Databricks, or BigQuery account and instantly understand your savings potential.

