Using SELECT
Workloads
Overview
SELECT helps Snowflake users understand their usage by categorizing SQL queries into workloads. By calculating the cost of each query in a workload, SELECT can surface your top consumption drivers. This helps customers prioritize optimization efforts and ensure they are effectively using Snowflake.
Query Patterns
By default, SELECT categorizes all queries into individual "Query Pattern" workloads. All queries are run through a custom query parser which standardizes the SQL into a recurring Query Pattern. In the example below, literals in the where filters are stripped out in each query, resulting in both queries being matched to the same pattern.
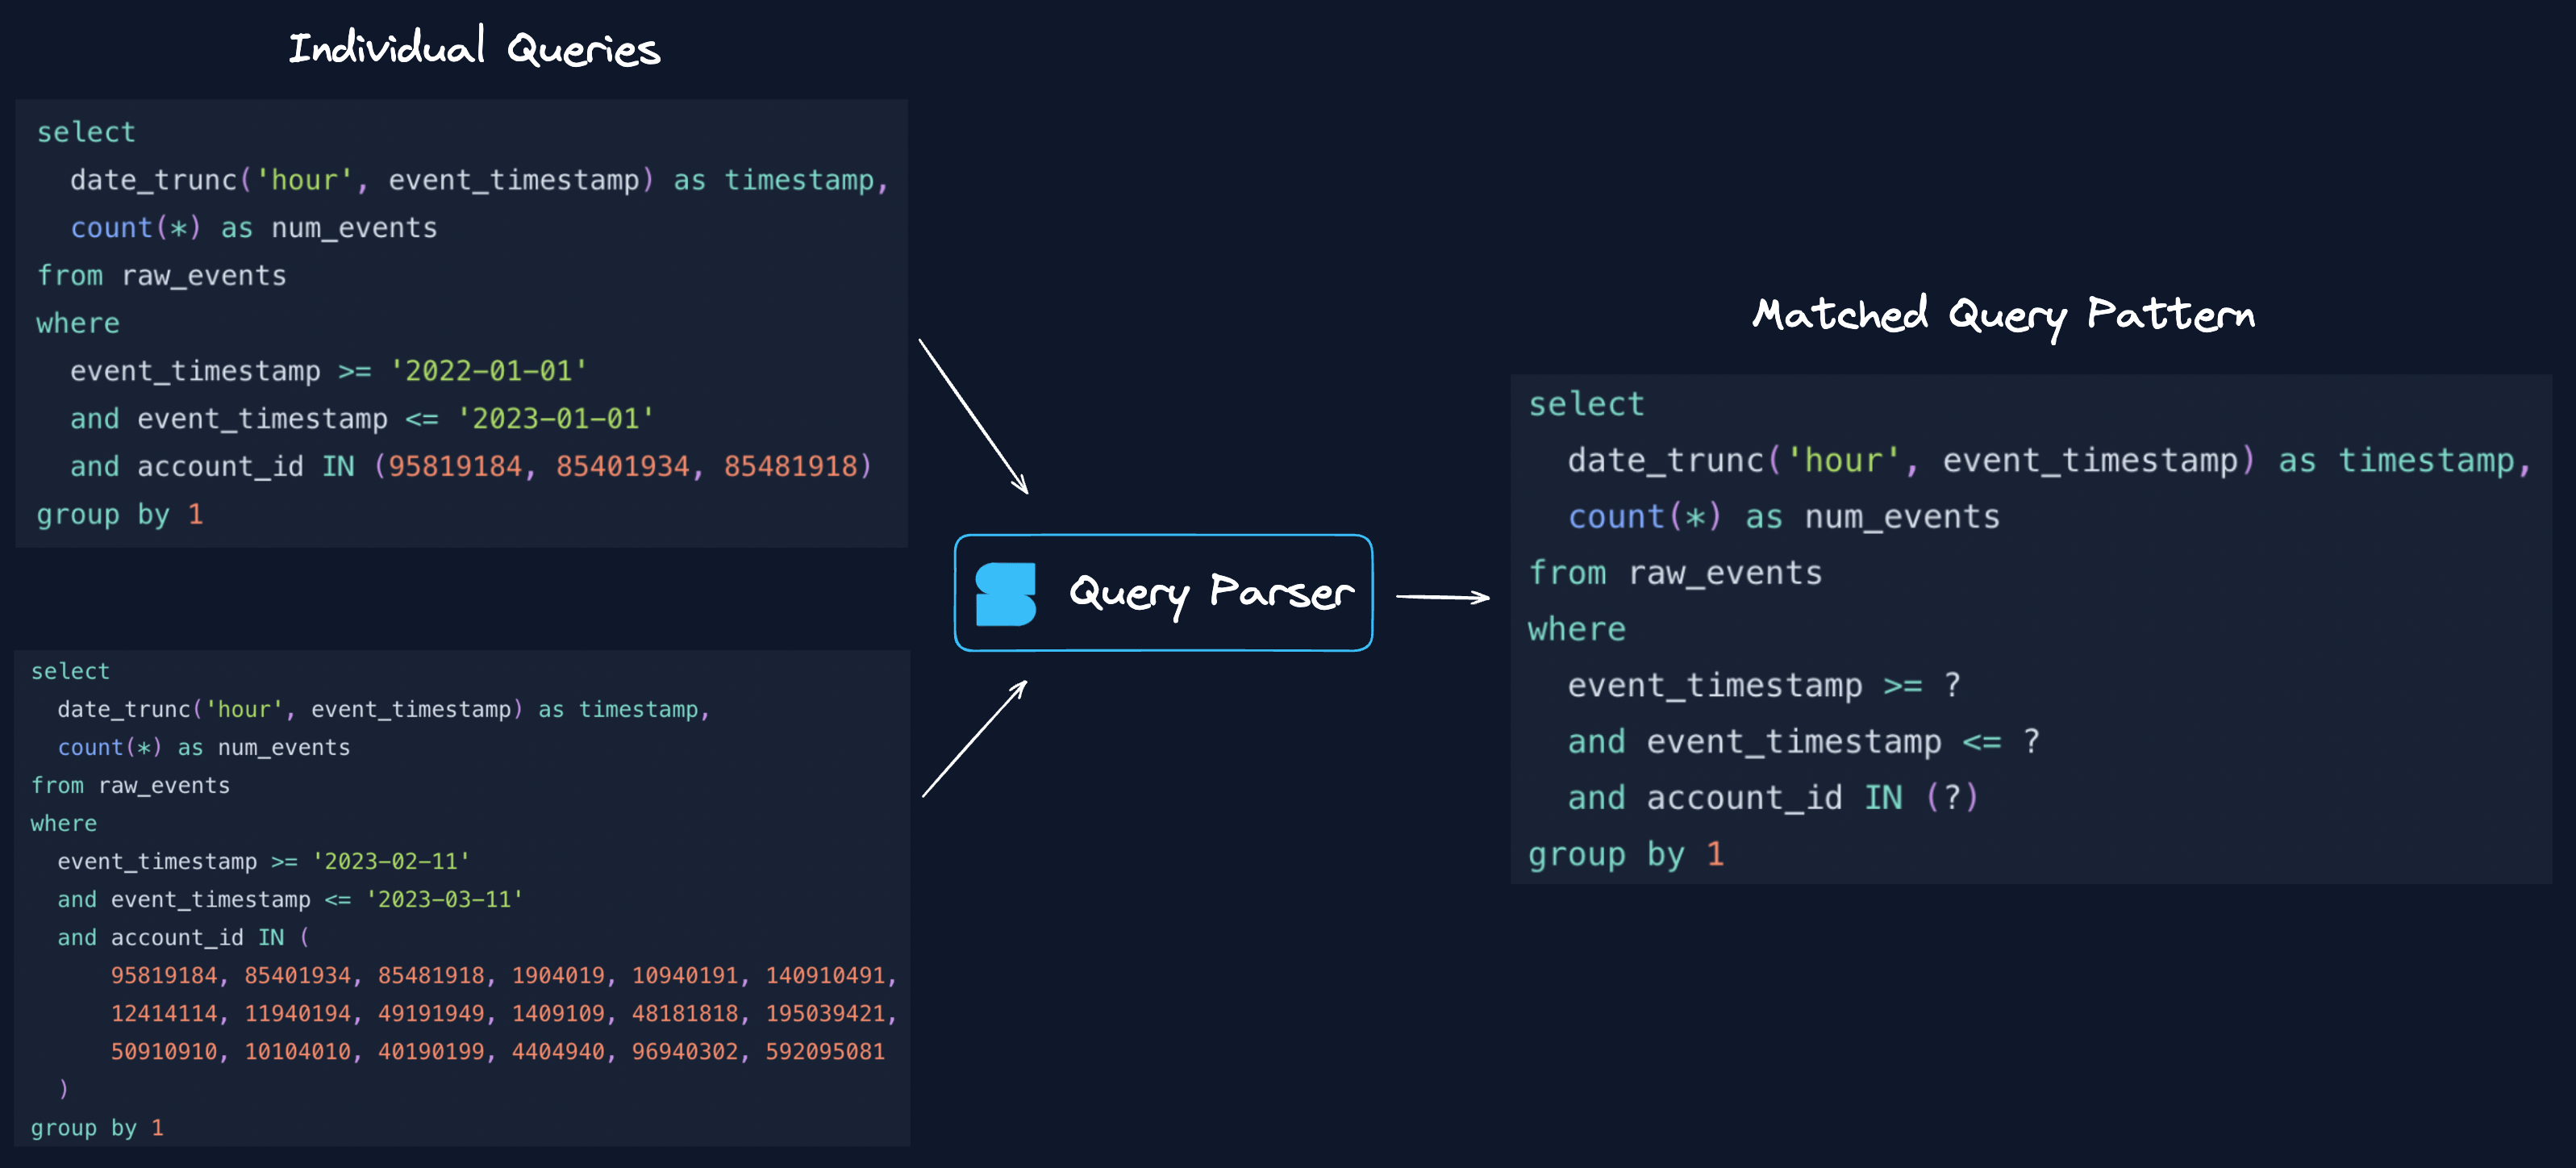
By analyzing the cost of Query Patterns instead of individual queries, users can spot frequently running queries that add up in cost.
Each Query Pattern has a dedicated page where SELECT users can see an overview, costs and performance statistics over time, and the full query history.
Metadata-Based Workloads
One of the downsides of Query Patterns is that structural changes to the SQL text will result in a new Query Pattern being created. This can make it difficult to understand the impact of changes to a query that is associated with a business process. Additionally, users must analyze the query text, username and warehouse of a Query Pattern to understand what system or business process it is a part of.
To support this, SELECT has created several different metadata-based workloads. Instead of grouping queries that have the same underlying SQL pattern, SELECT leverages query comments and query tags. This allows for a more natural and flexible grouping of queries. For example, a given Looker dashboard can consist of 50 different queries that run every time the dashboard is refreshed. The individual queries can be cheap, but, when grouped, quite expensive.
Similar to Query Patterns, each workload has a dedicated page with cost & performance trends, and optimization insights.
The following is a list of metadata-based workloads supported by SELECT:
- Custom Workloads: add your own tags / comments to queries running in your account
- dbt: understand the cost of all dbt resources (models, tests) and analyze your run performance
- Fivetran: analyze the compute costs from Fivetran loading each table into your account
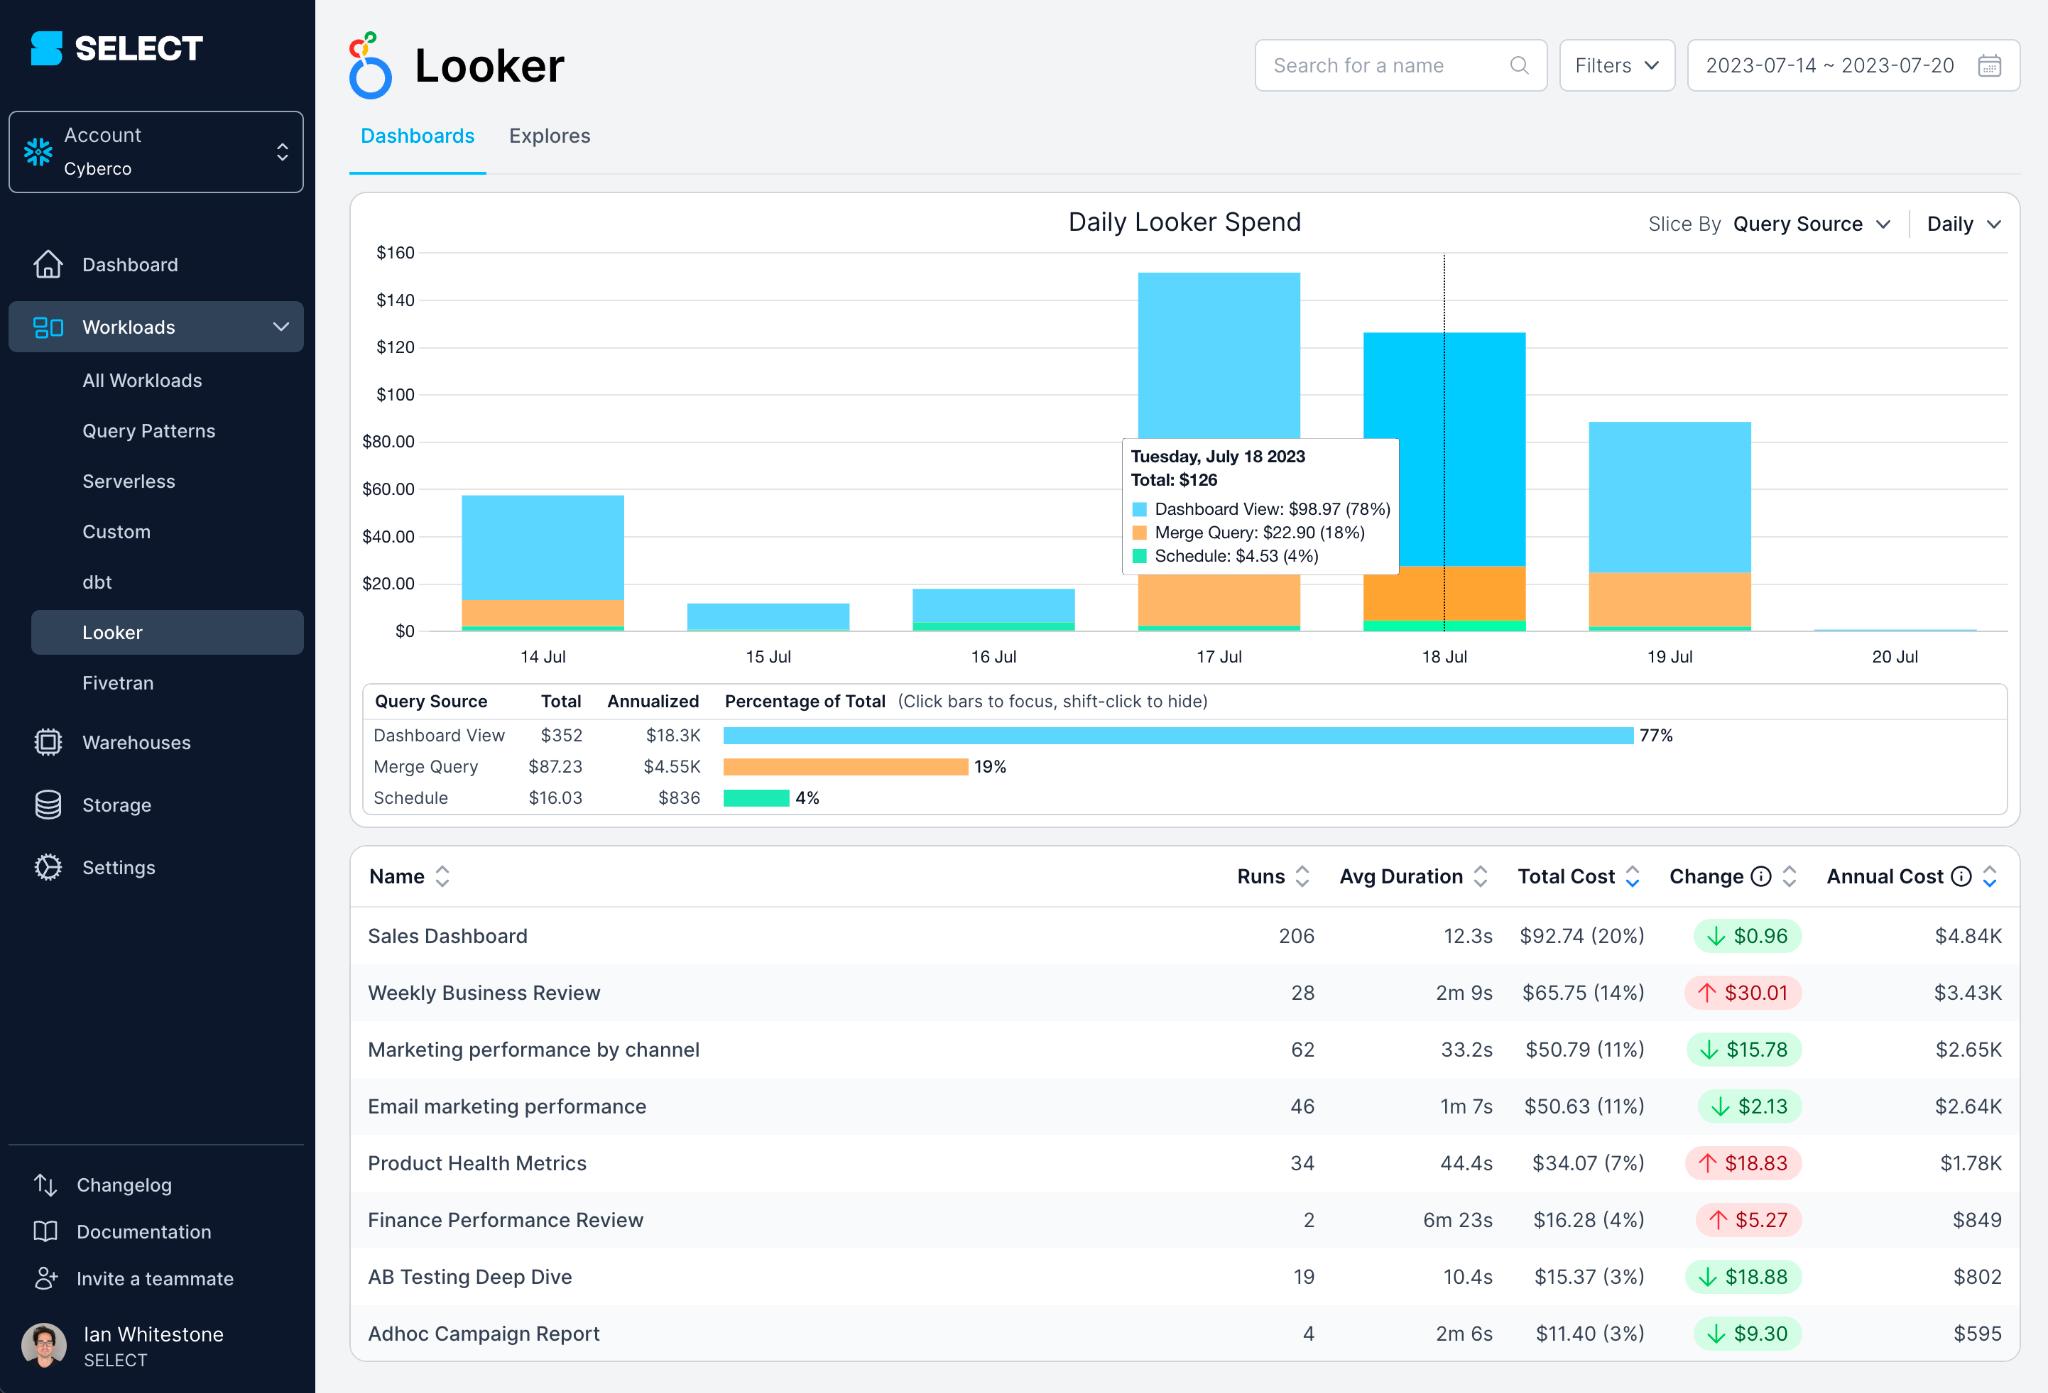
- Analyze the cost of each dashboard or business user in your BI Tools:
Tasks
Customers often use Tasks to orchestrate their various workloads in Snowflake. SELECT provides native cost and performance monitoring support for Snowflake Tasks. To view details about your Tasks, click on Workloads -> Tasks from the sidebar. Similar to other workloads, you'll see an overview of all Tasks in your account:
Click on any task to see details around its configuration, along with costs, performance and any related insights:
In this example above, you'll see the task calls a stored procedure call dev_select_ingest.fernando.sproc_root(0) each time it runs. From the Run History tab, you can drill into individual runs of a task to see all the queries kicked off as part of that stored procedure call:
Serverless tasks
Serverless tasks are included on the Tasks page. Our cost-per-query algorithm has been updated to account for queries that run on serverless compute.
You can see the type of task using the "Task Compute Type" column, and filter on it accordingly.
Stored Procedures
Stored Procedures are often created to run specific "jobs" or "workloads" in Snowflake, like loading a table or triggering an ETL process. SELECT provides native cost & performance tracking for Stored Procedures, by grouping together the CALL query triggered by a Stored Procedure, along with all the child queries it may kick off in the same session. To view details about your Stored Procedures, click on Workloads -> Stored Procedures from the sidebar:
Click on any procedure to see details around its configuration, along with costs, performance and any related insights:
From the Run History tab, you can drill into individual queries kicked off as part of that stored procedure call:
Dynamic Tables
Snowflake Dynamic Tables are a feature that allows you to define tables that are automatically and incrementally updated as the underlying data changes, based on a query definition. SELECT provides neative cost and performance insight for Dynamic Tables by tracking execution of both the queries that monitor data freshness of upstream sources and the queries that refresh the table.
To view the details about your Dynamic Tables click on Workloads -> Dynamic Tables in the sidebar:
Click on any Dynamic Table to see details it's configuration along with costs, performance, and related insights:
In the Run History tab, you can drill into both the freshness monitoring and refresh queries for a Dynamic Table:
Serverless Workloads
SELECT also surfaces the cost of different serverless workloads running in Snowflake:
- Automatic Clustering
- Snowpipe
- Serverless Tasks
- Search Optimization
- Materialized Views (coming soon)
- Database Replication (coming soon)