Feature Overview
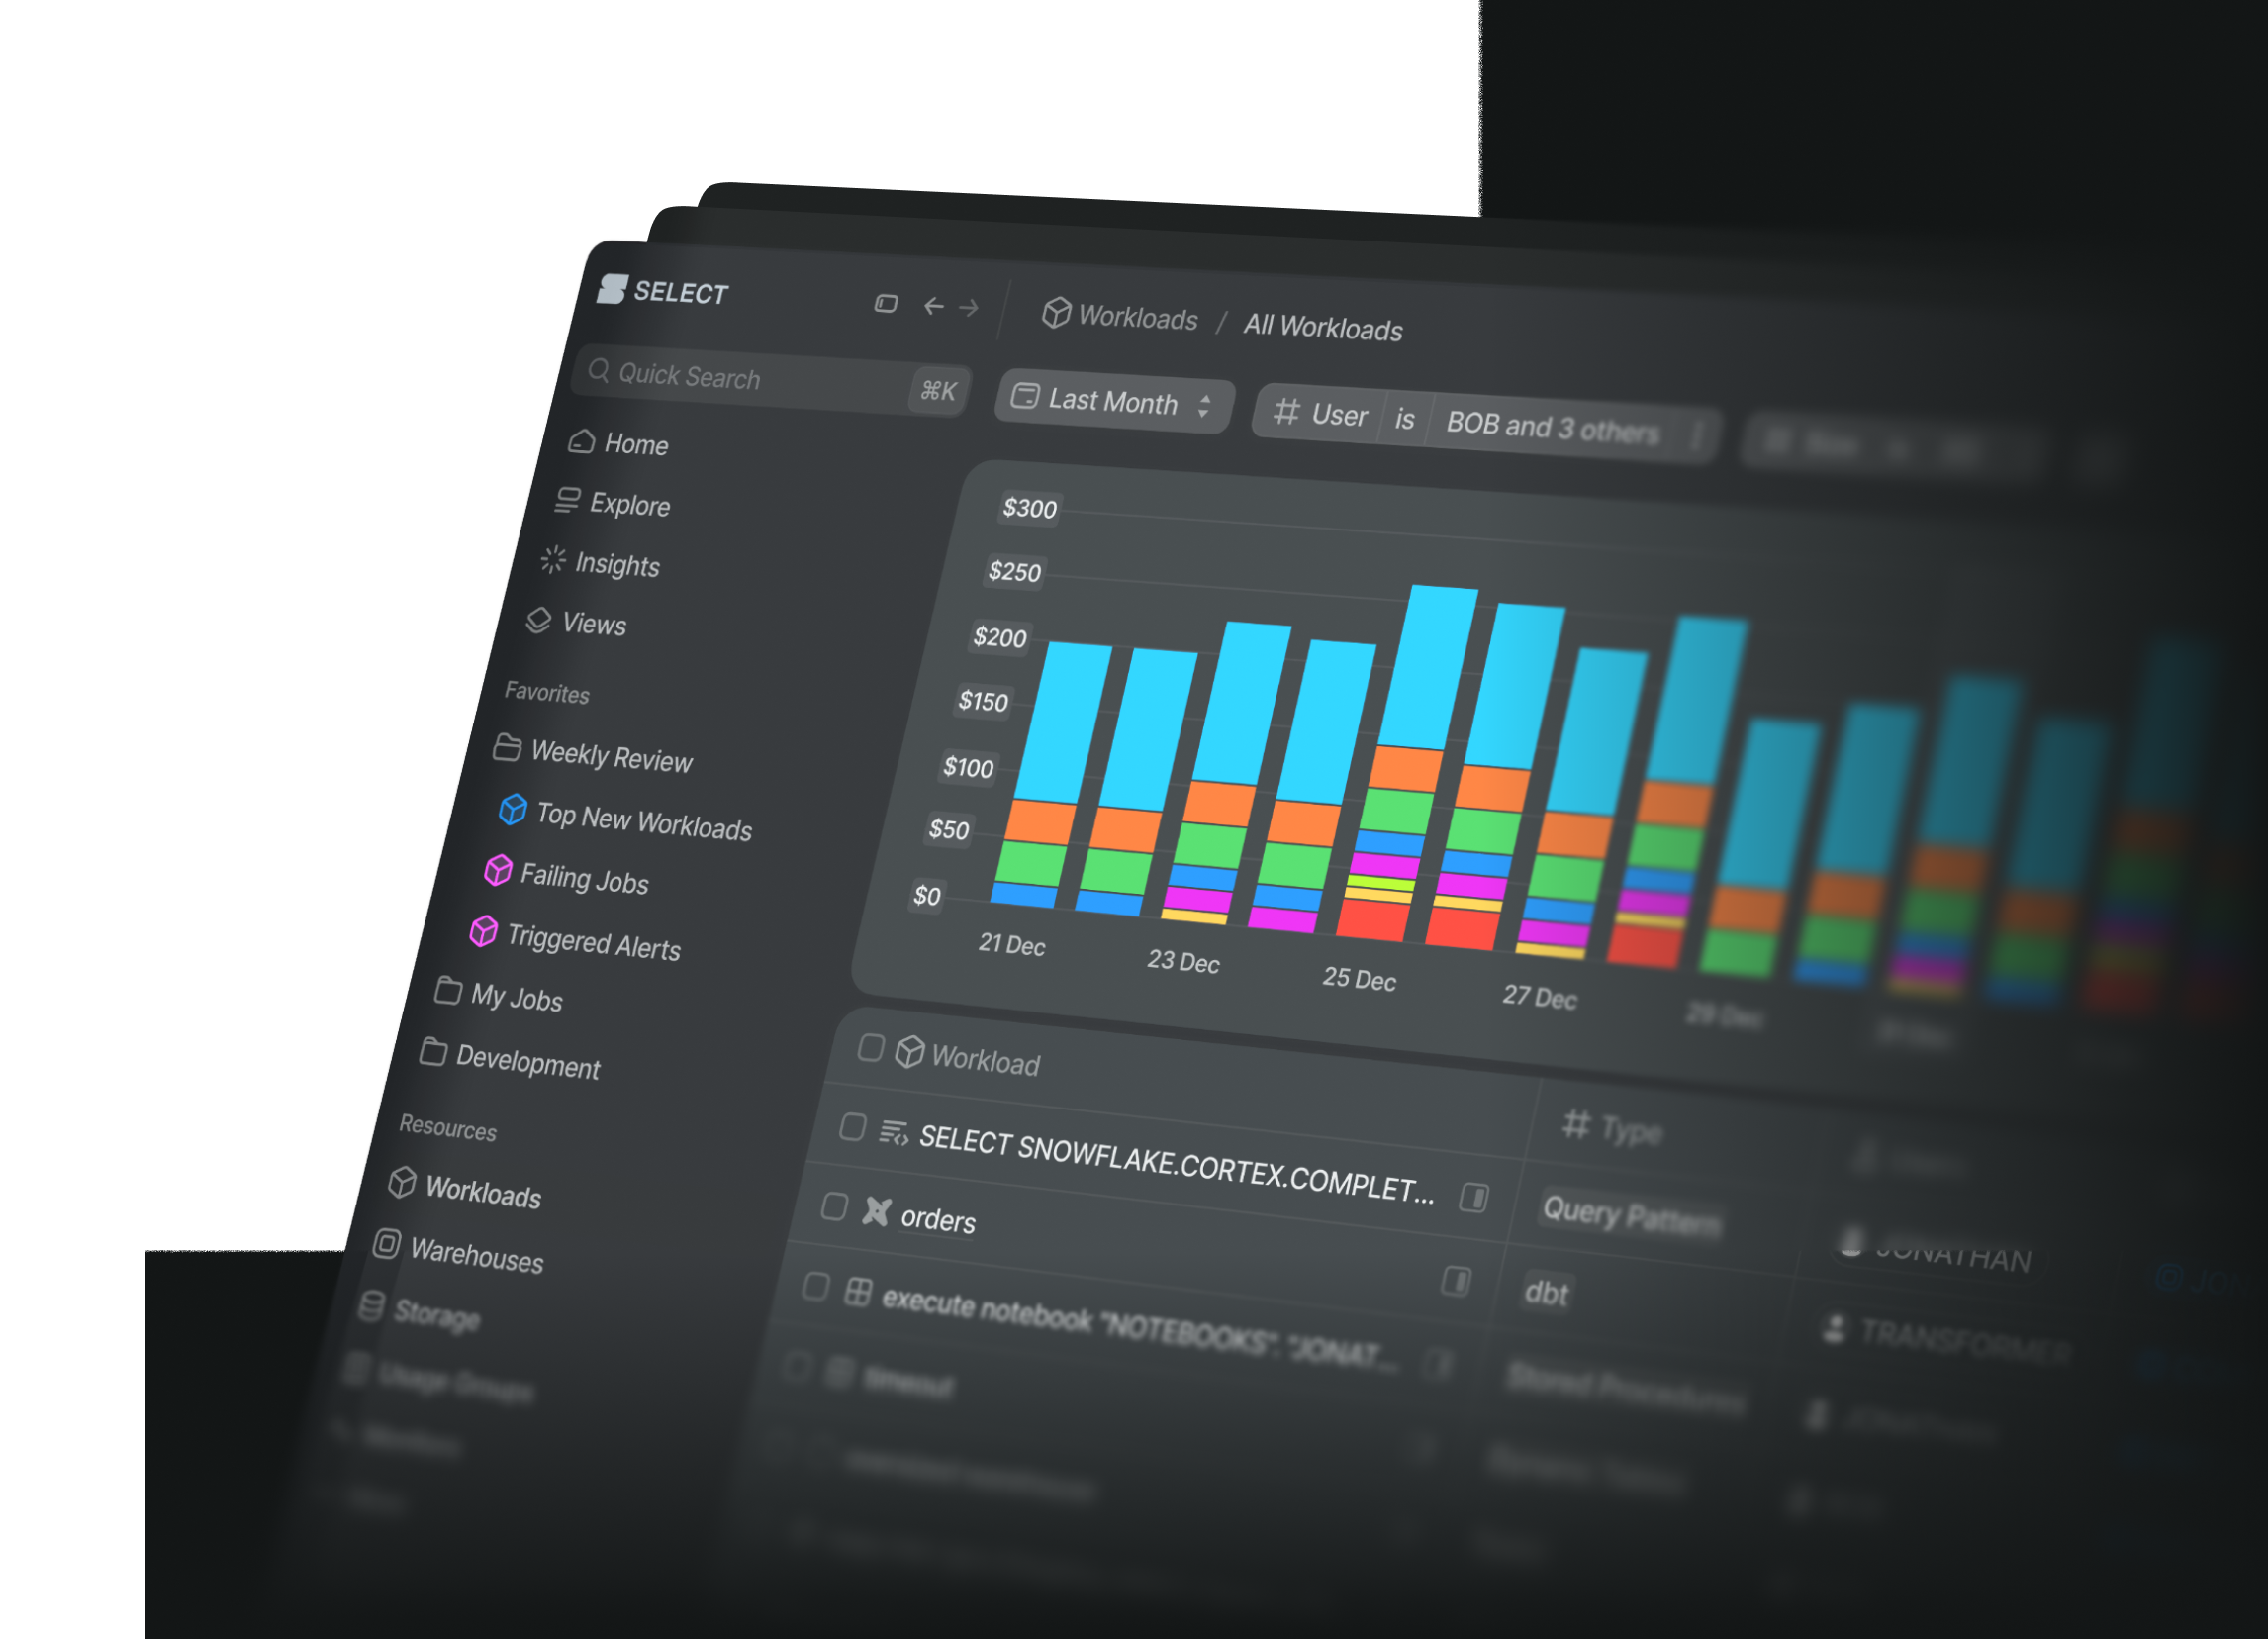
The Looker integration attributes query costs to dashboards, looks and explores. Use this feature to identify expensive workloads requiring attention, or identify opportunities to deprecate unused reports and save costs.
Use the query timeline view to understand dashboard performance bottlenecks or costly queries, or leverage the Cost and Performance tabs to see how dashboard usage statistics have been trending. On the Run History tab, you’ll see a complete history of all dashboard runs including which user triggered the run and any error messages they saw.
To do this, SELECT runs metadata extracts from Looker's System Activity Explore. To set up the integration, follow the steps below.
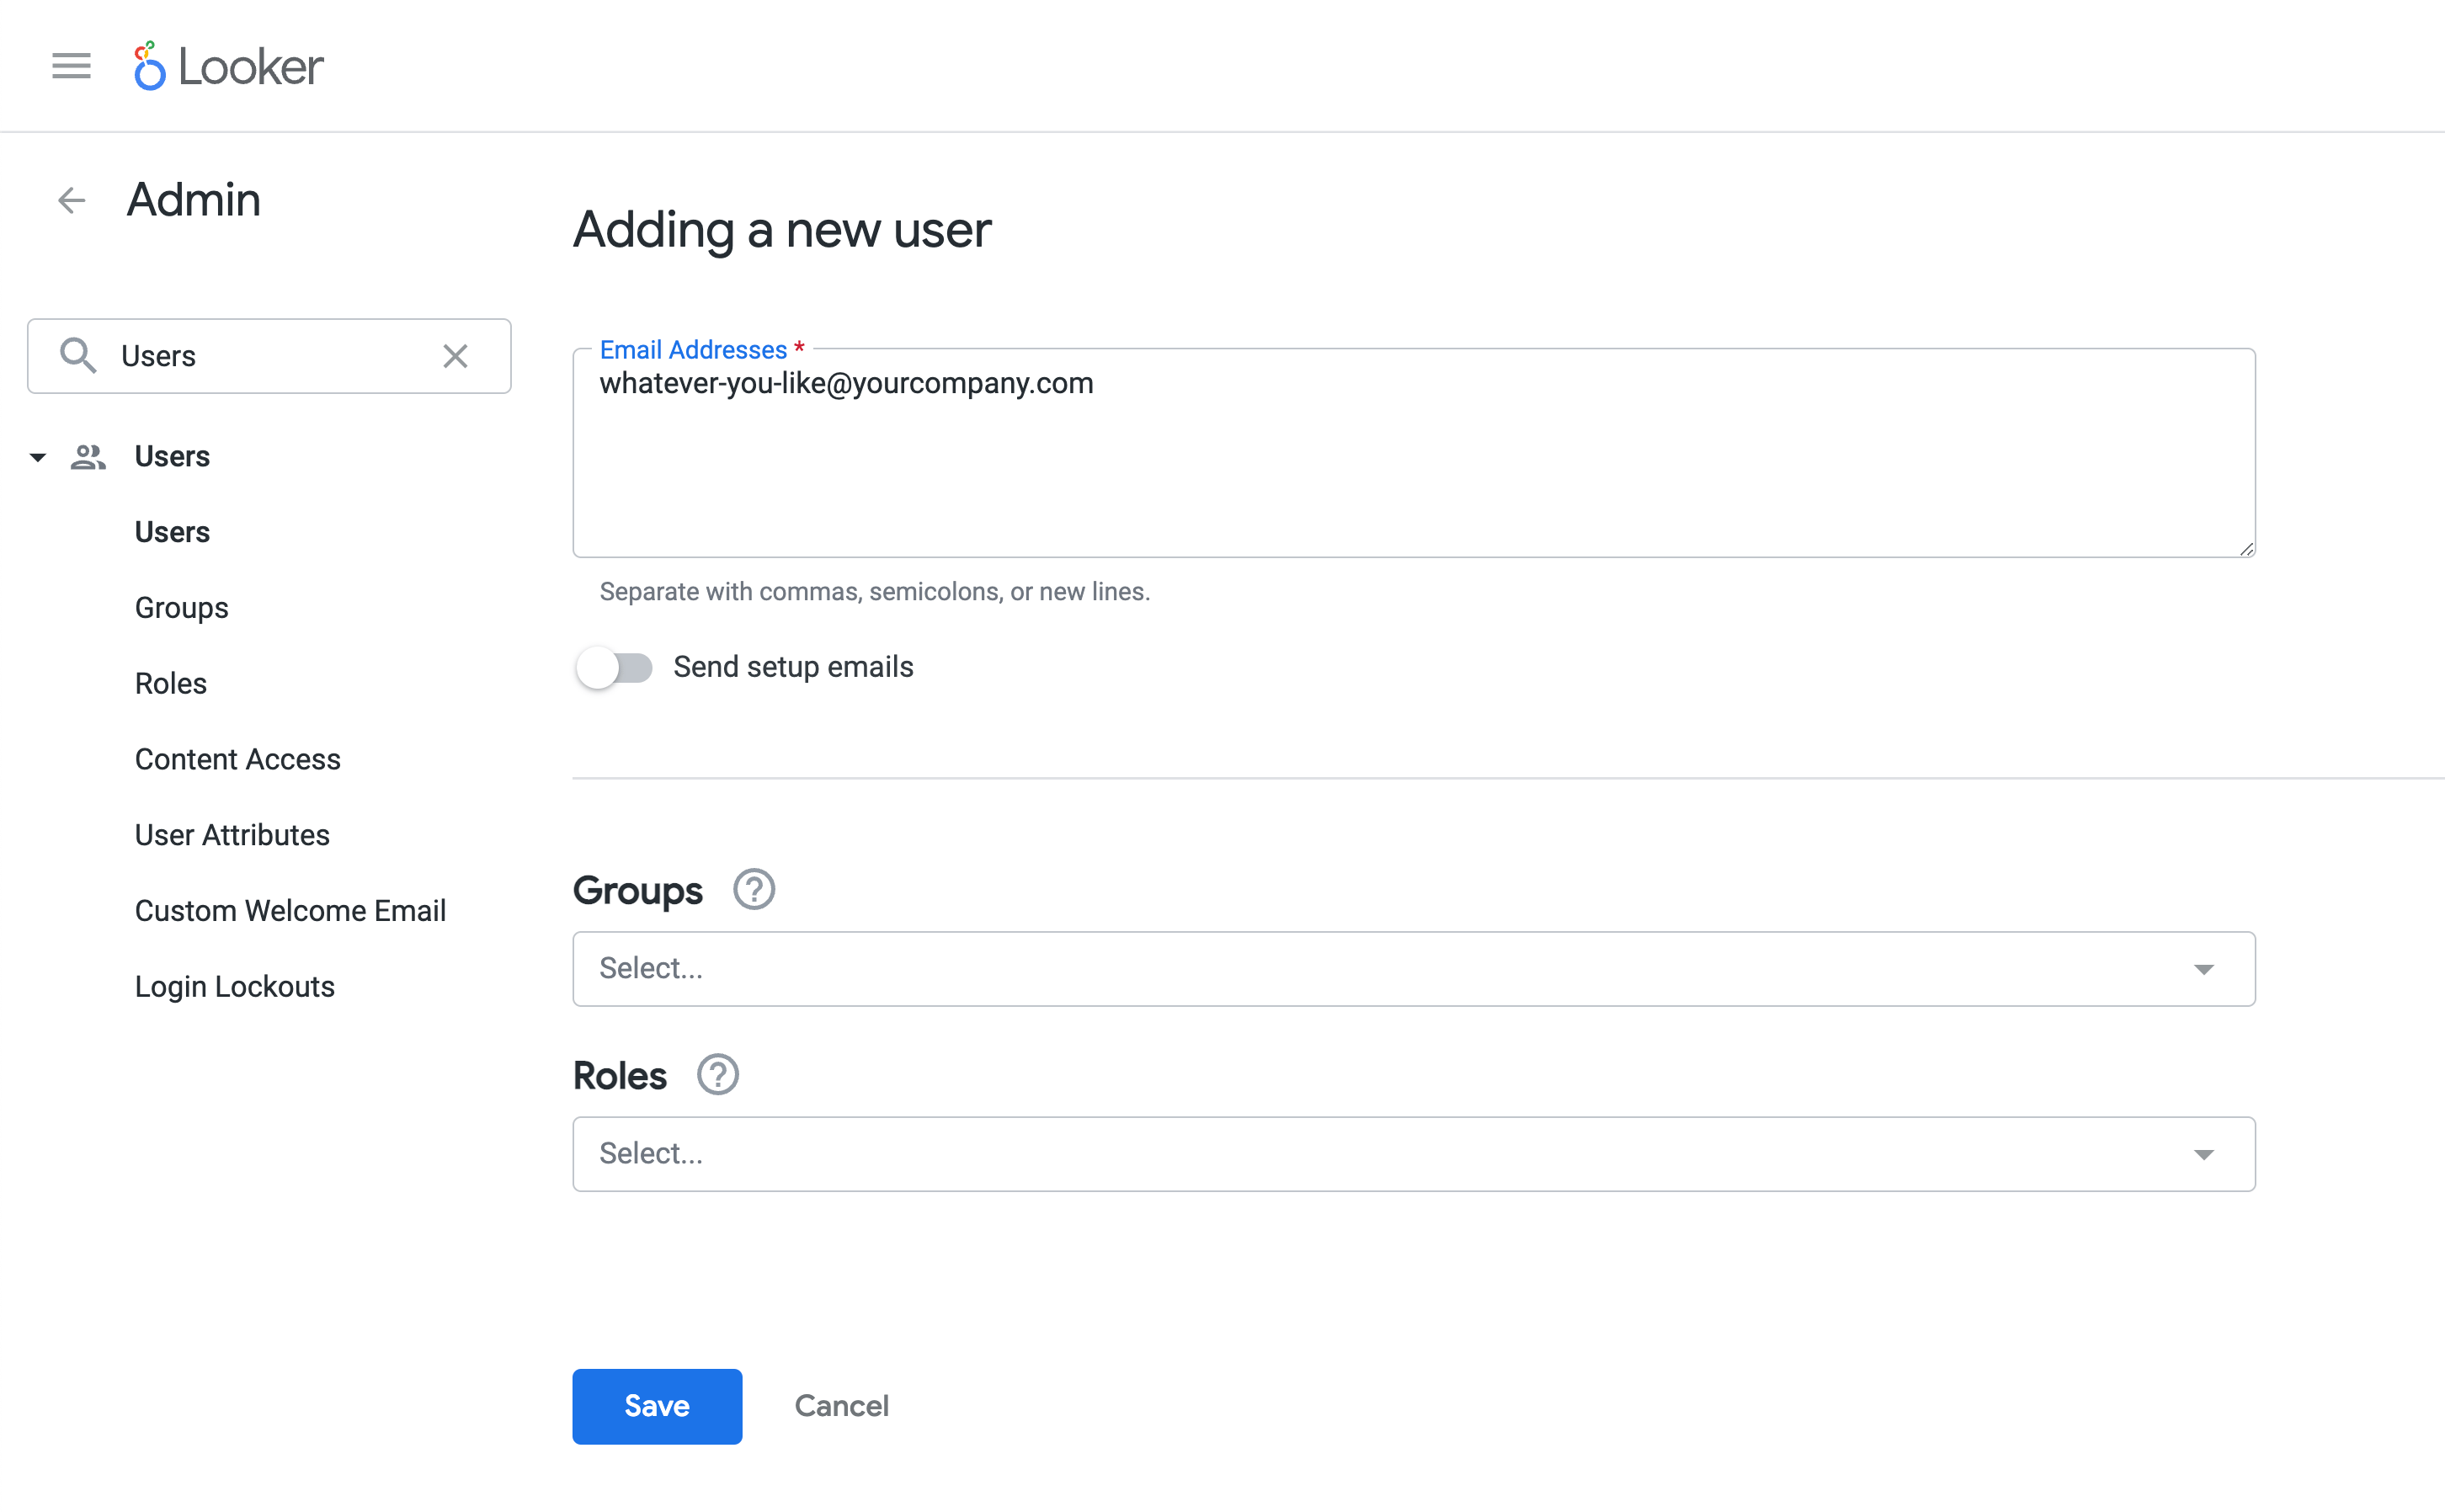
Step 1: Create a new user in Looker.
The email address can be absolutely anything.

Step 2: Create API keys for the user
Record the Client ID and Client Secret as these will be entered into SELECT.

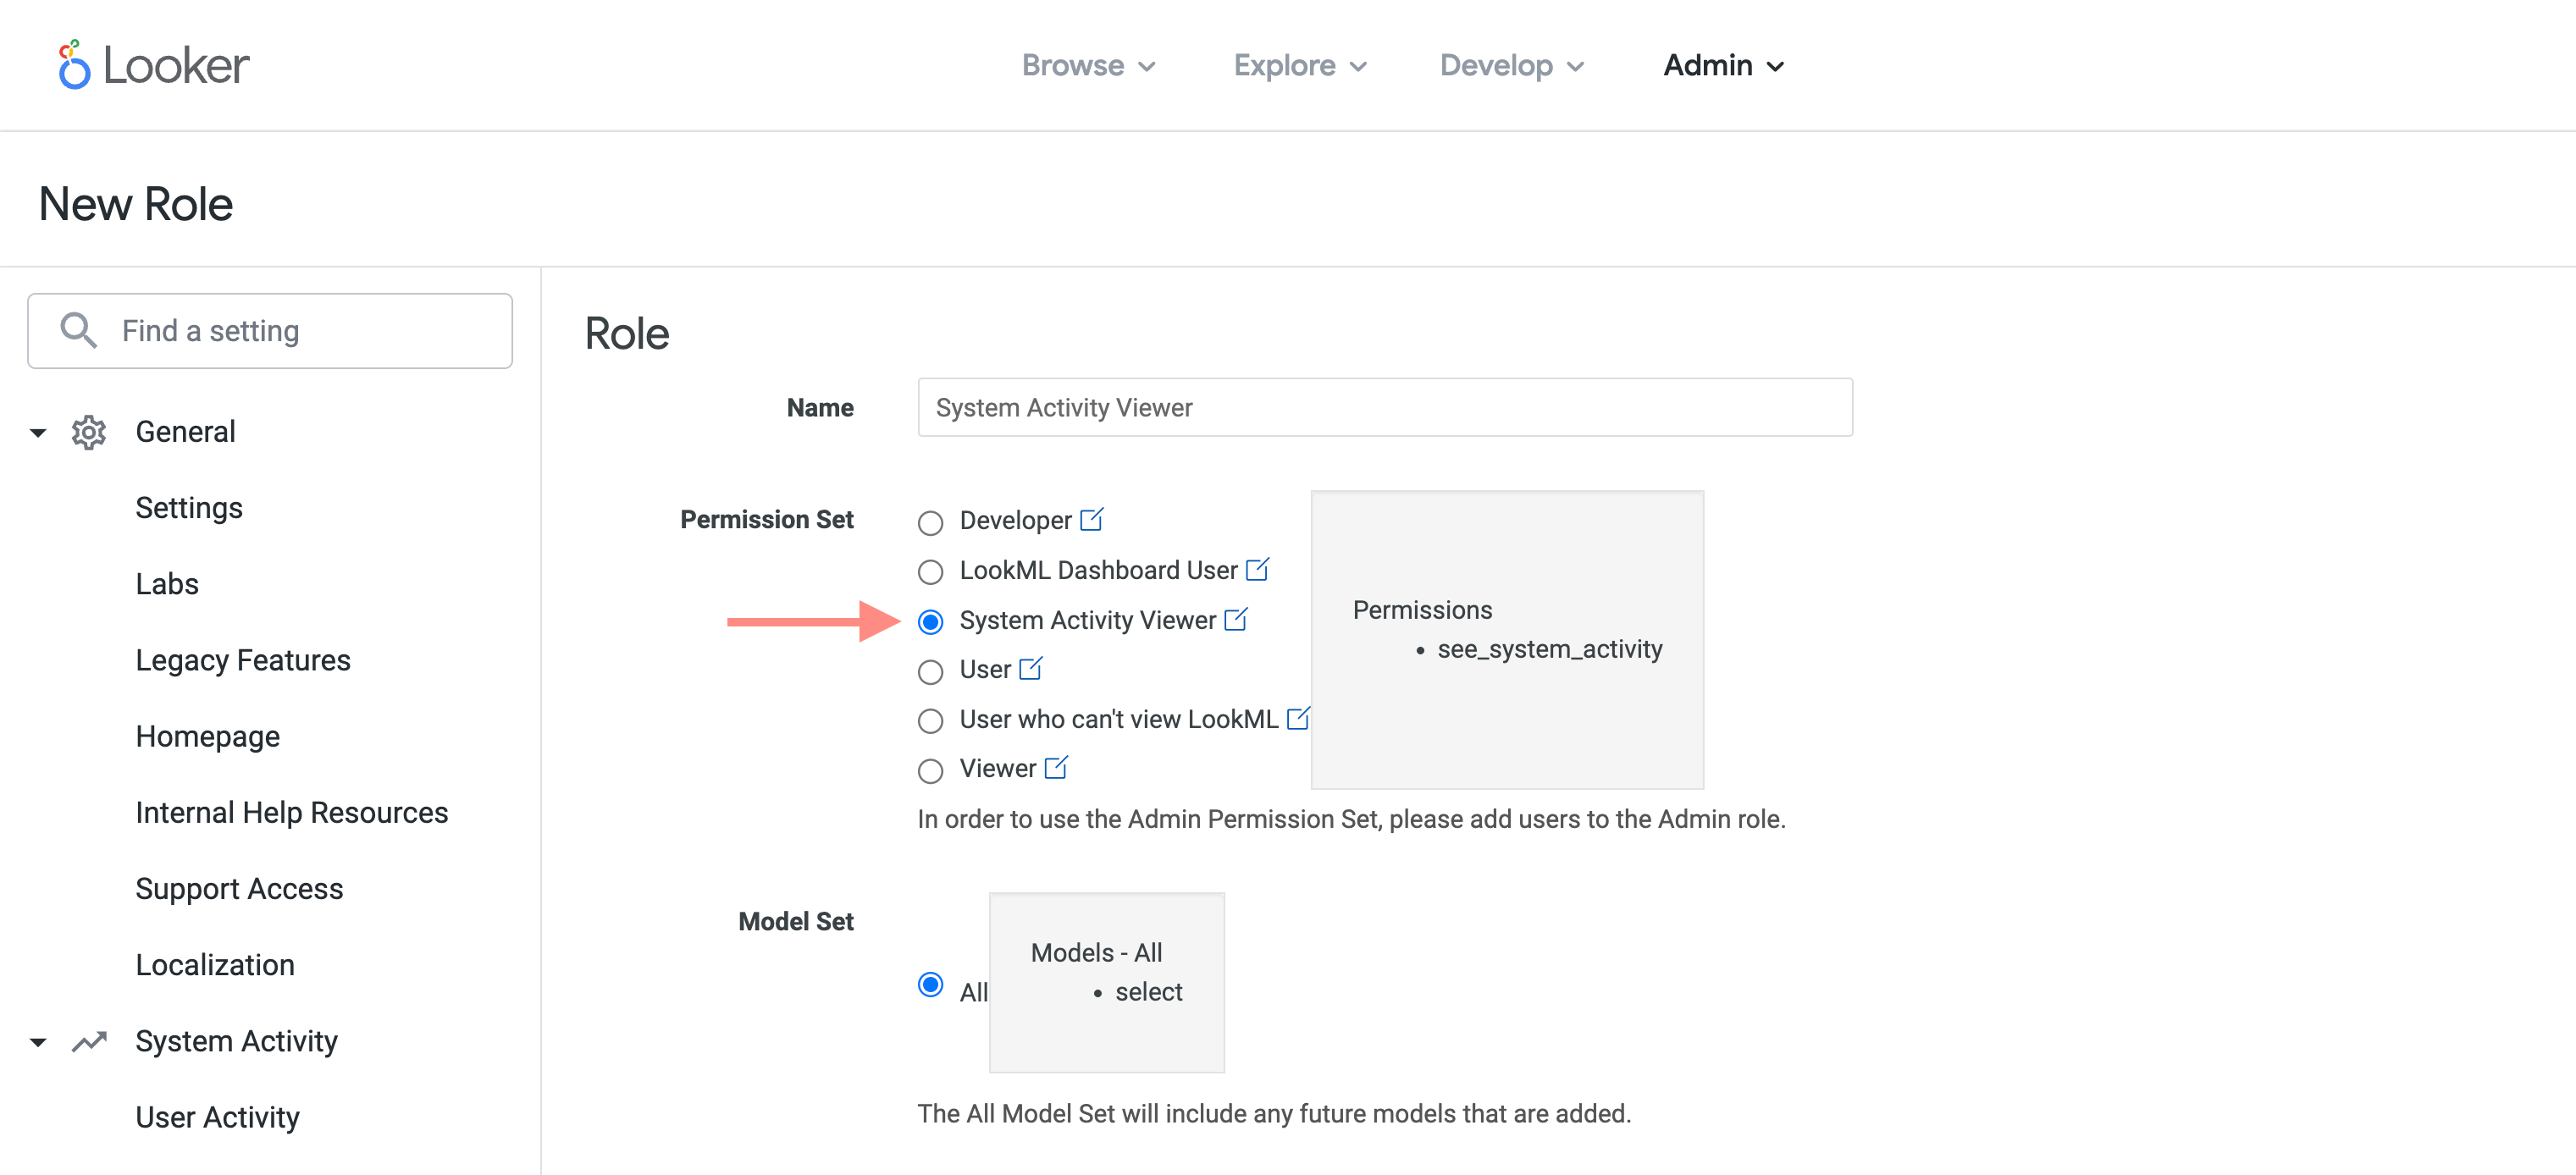
Step 3: Create a new Permission Set under Roles
We recommend using the name 'System Activity Viewer'.

Check the 'see_system_activity' box under permissions.

Step 4: Create a new role
Again, we recommend calling it 'System Activity Viewer'.

Assign the 'System Activity Viewer' permission set to the role, and grant the role to the user created in step 1.

Step 5: Input into SELECT
Head to SELECT's settings page, and then the Looker tab.
To find the Base URL value, go to the Platform -> API page in Looker's Admin settings, and see 'API Host URL'.
Next, enter the Client ID and Client Secret from Step 1, and finally click 'Update'. There will be a short delay while permissions are validated.

Step 6: All done!
SELECT will now runs metadata extracts from Looker and attribute your query costs to different Looker assets in the SELECT web application. Information will start appearing after the next metadata refresh.


