

June 2025 Product Release: Views, Favourites, Lineage Improvements, and More!
Jeff SkoldbergMonday, July 07, 2025
We're excited to share a quick update on what the SELECT team has been working on recently. Head to our changelog for a full list, or read below for the highlights.
Announcing Views, Filters & Favourites!
We recently rolled out a revamp of our Views feature and shipped a new favourites section in the sidebar, which we're quite excited about as we've found it super helpful in our own internal use of SELECT.
If you find yourself repeatedly applying a certain set of filters, columns, or looking at a specific slice of data in SELECT, you can save this selection as a View for easier reuse and optionally pin it to your favourites in the sidebar. Same goes for workloads which you regularly look at, which can also be pinned to your sidebar.
Here's a quick walkthrough and explanation of the feature, here.
We hope you find these helpful!
Redesigned Lineage View
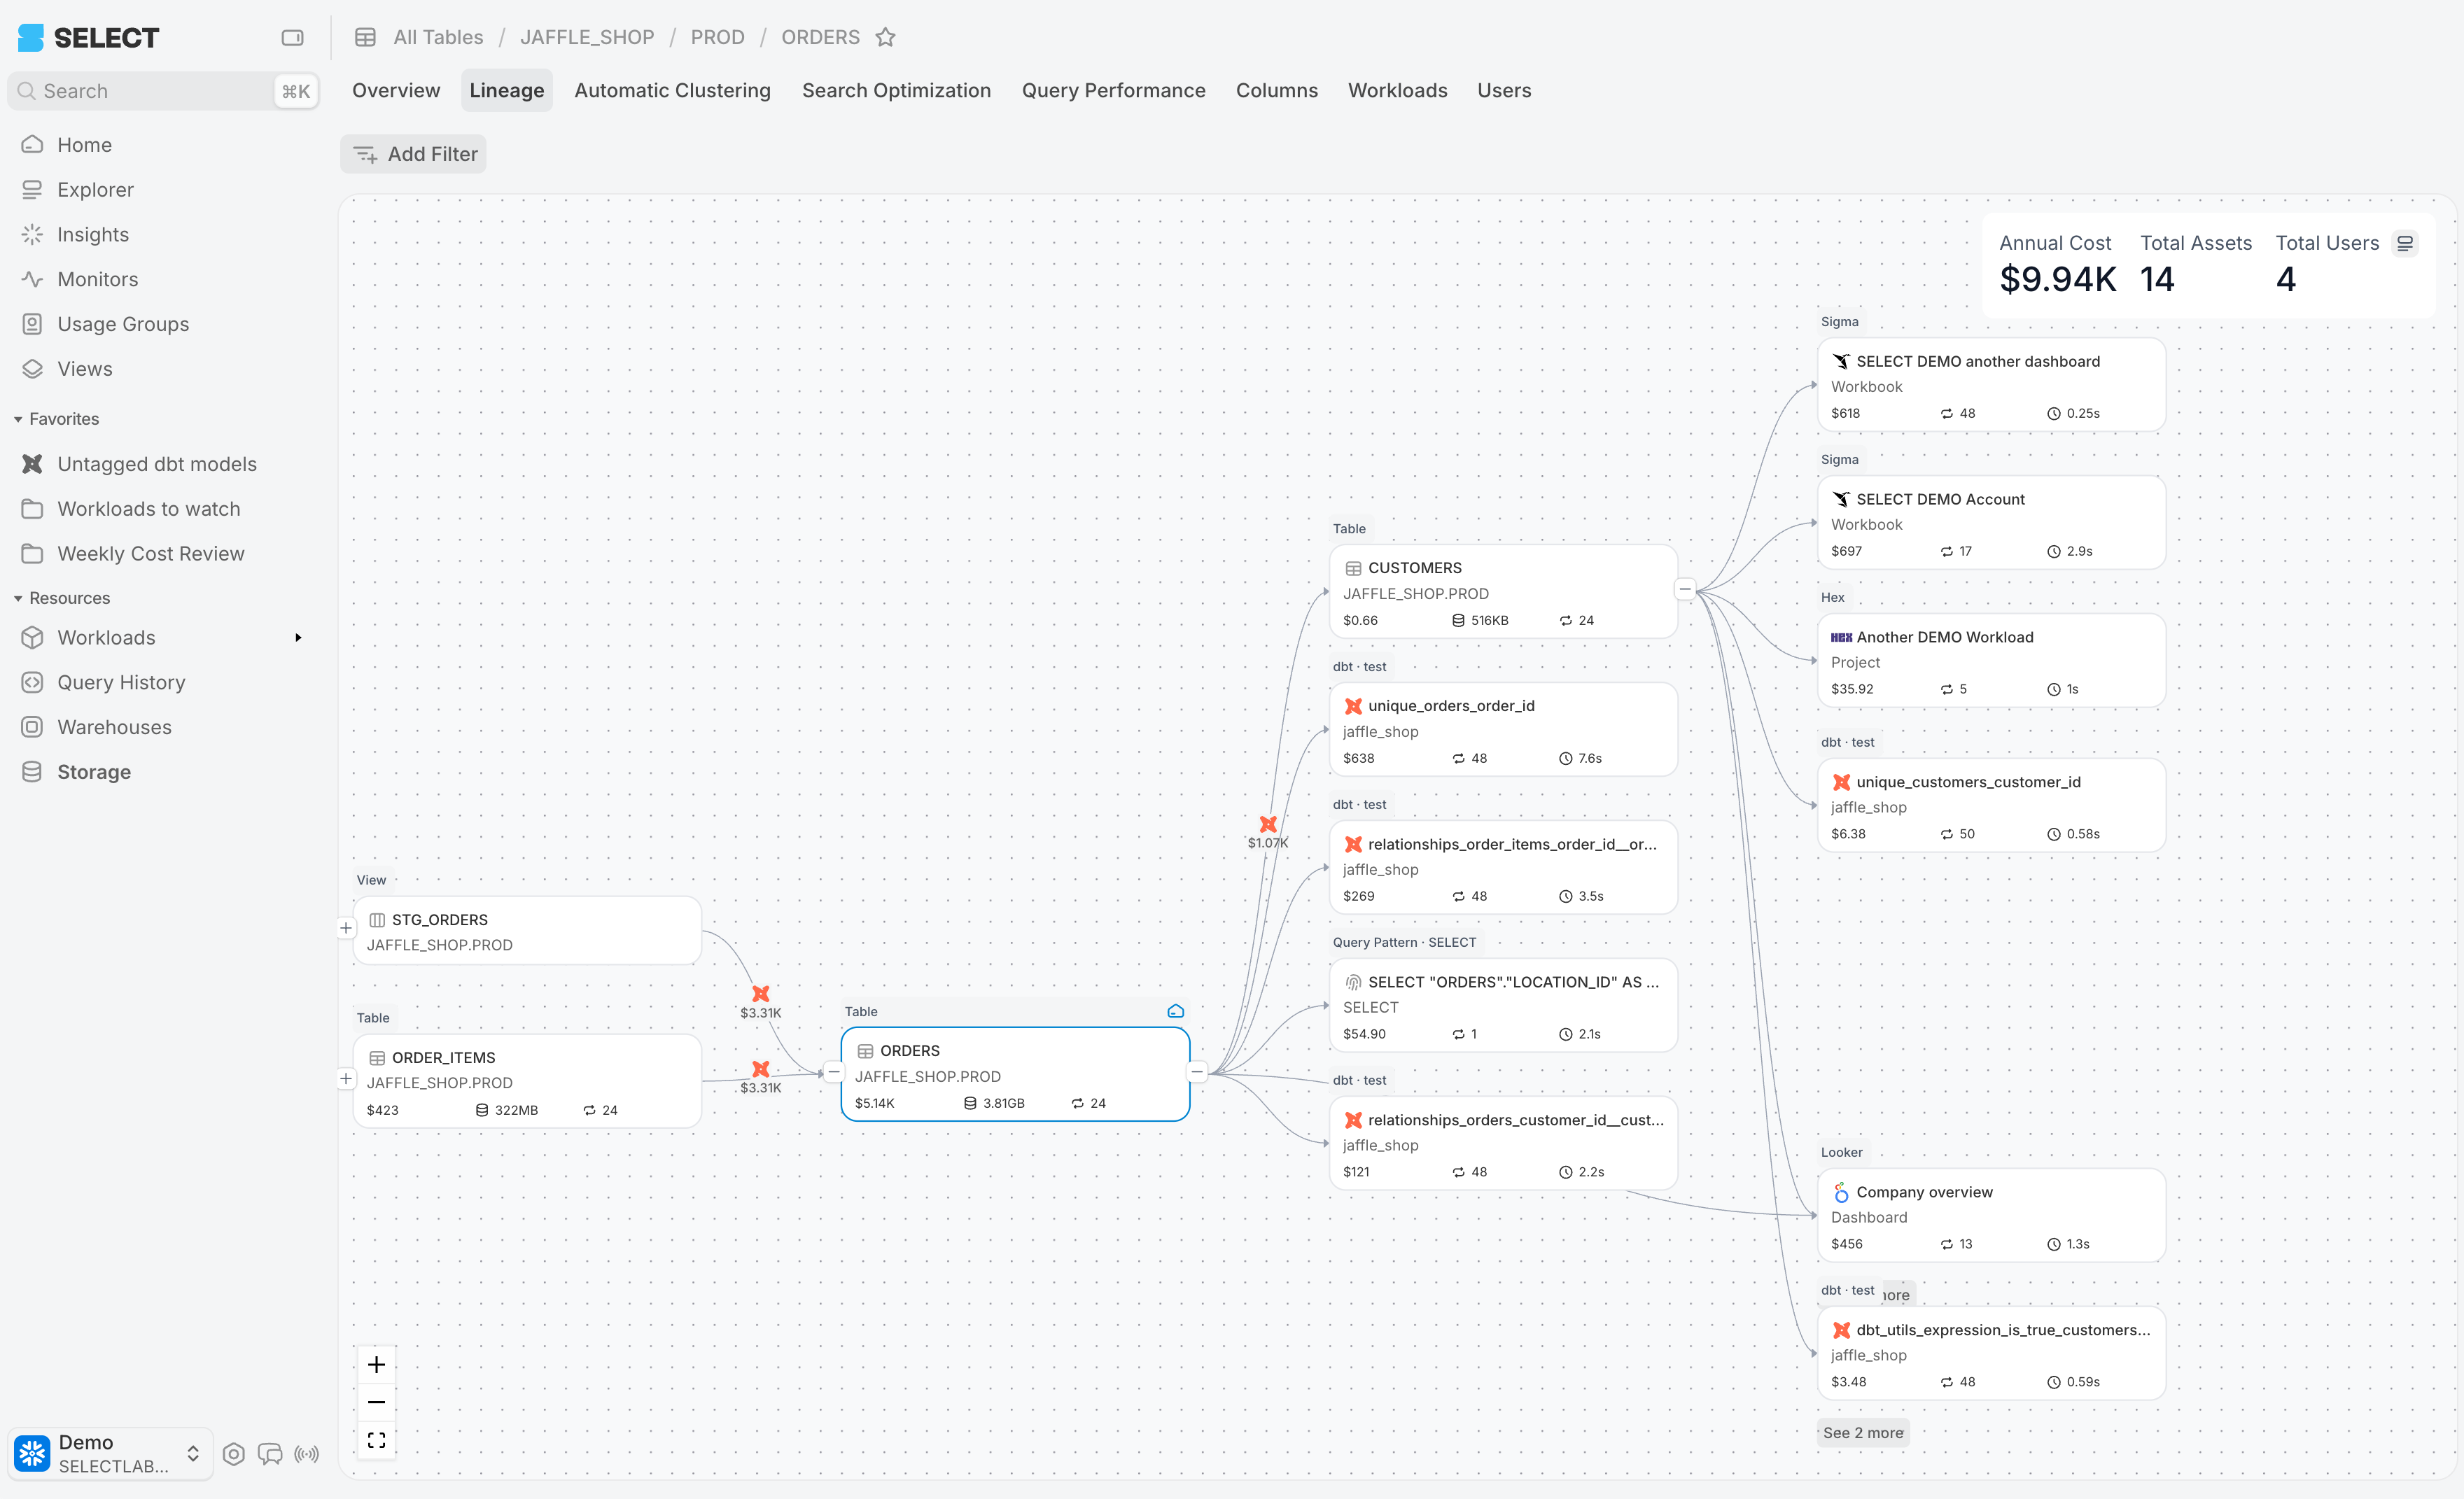
We’ve reimagined our Lineage graph to enable you to get to answers faster and hone in on the parts of lineage you care most about.
Now, workloads are collapsed into the edges of the graph to give a more familiar and precise lineage representation mapping the exact table-to-table relationships.
Quickly filter by database/schema (i.e. ignore staging or dev tables) or workload type (i.e. ignore ad-hoc queries and focus on specific workloads). Drill into an individual workload on an edge to get its full cost details.
A more traditional approach to lineage + advanced filtering in SELECT
Full Snowflake Query History in SELECT
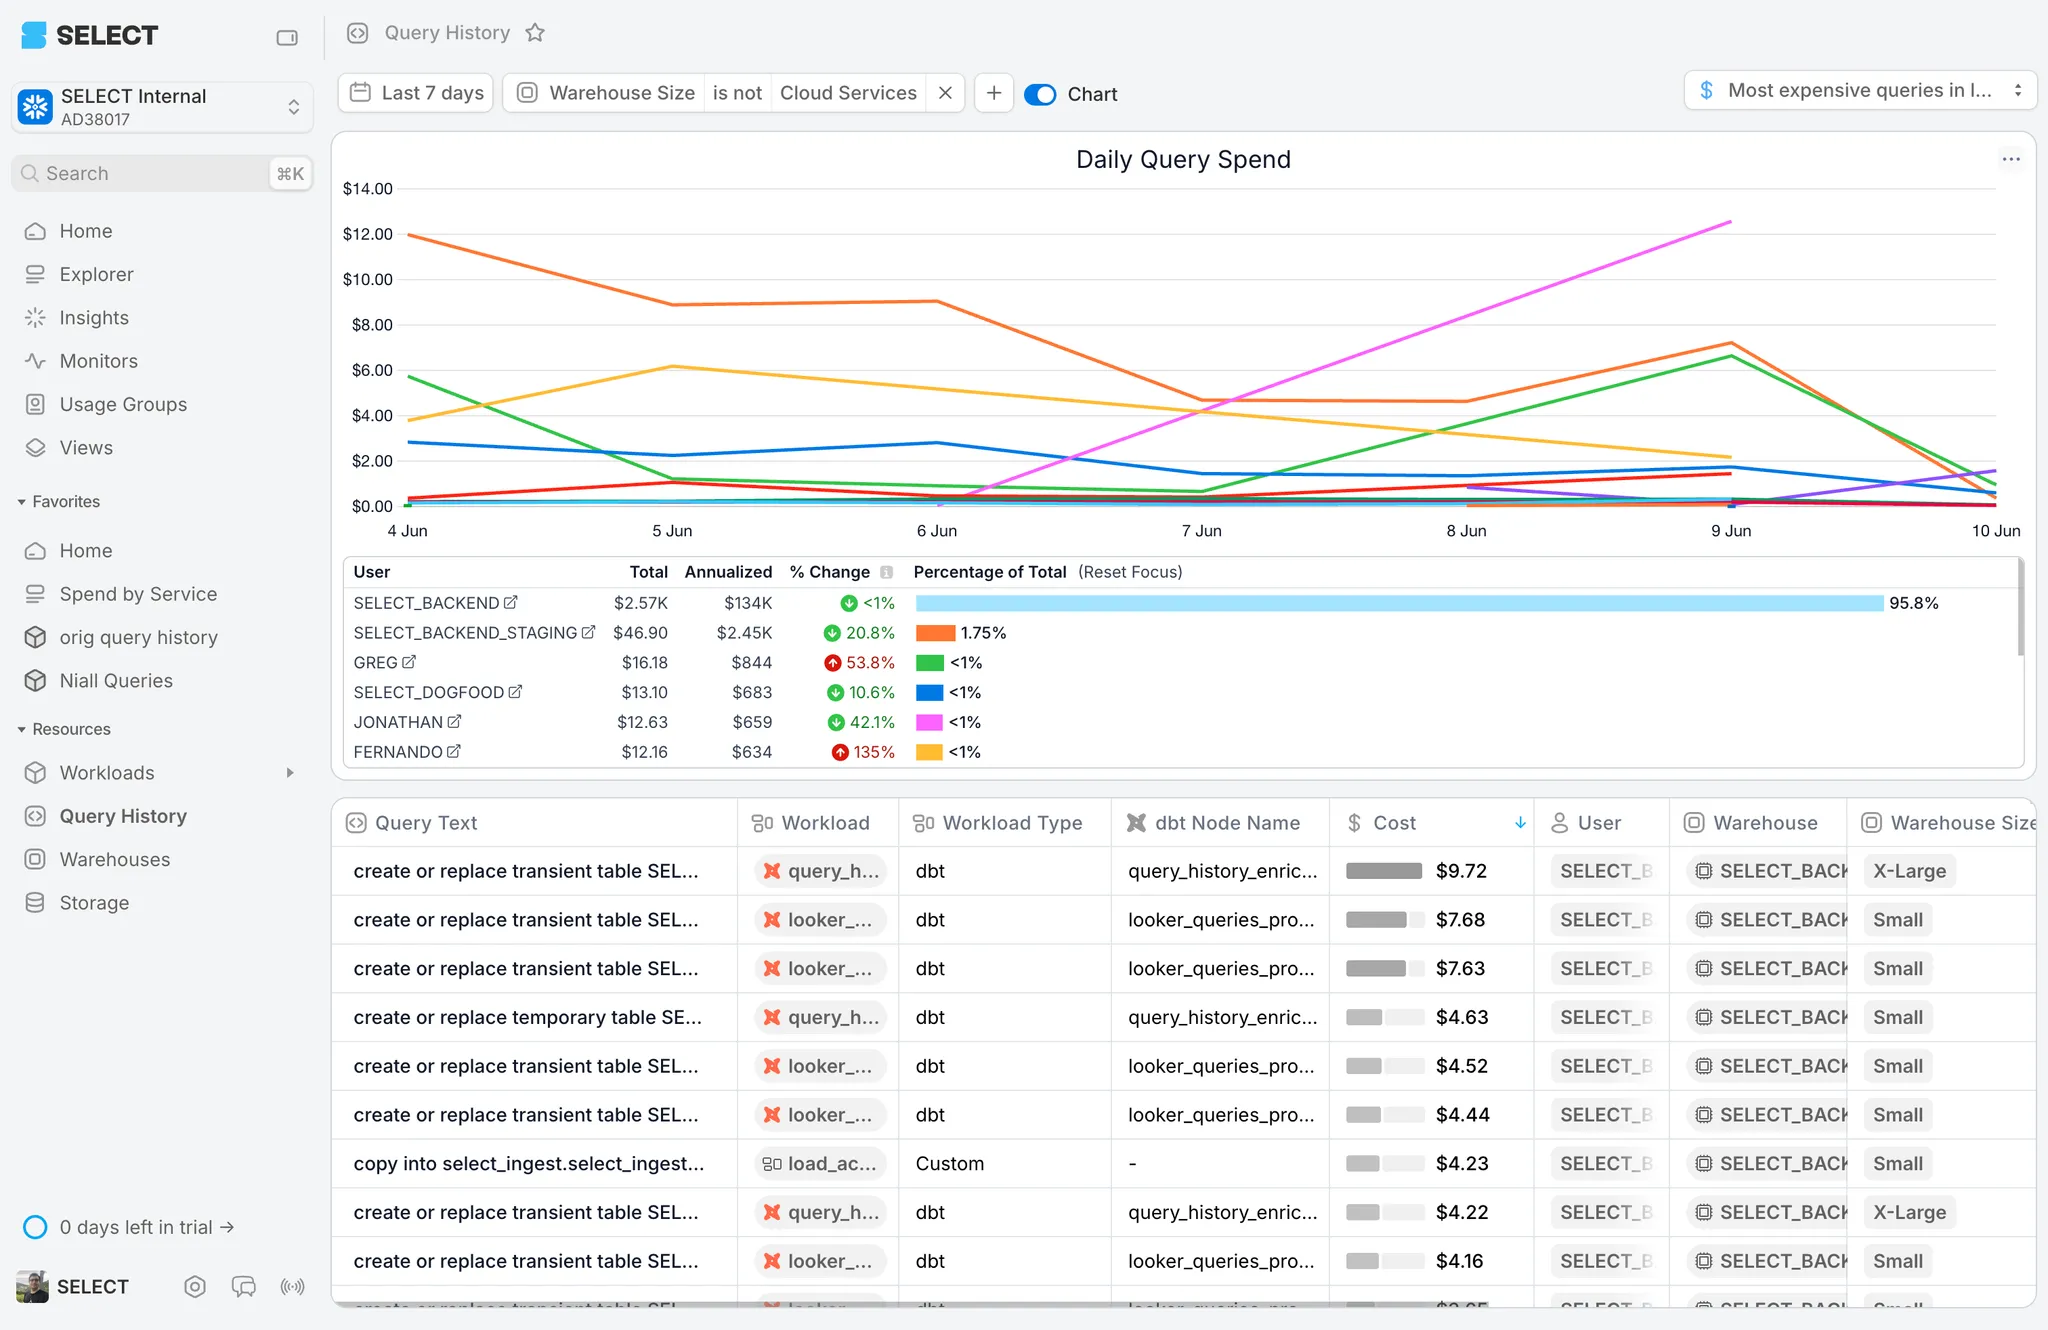
Snowflake users commonly need to track queries from specific dashboards, models or other workloads. Now you can do this even faster using the Query History tab in SELECT.
The Query History tab provides information above and beyond the native Snowflake query history. In SELECT, you can view cost information and which dashboards, workflows, and models initiated each query. Further, the history is available for a full year! Our filtering is very robust; available filters on this page include:
- Tables/views a query accessed or modified
- Workload metadata (i.e. you can filter to all queries coming from a dbt model or Looker dashboard)
- Cortex AI models used
- And many others, including any other column available in the Snowflake Query History View
Of course you can save your view, and pin it to your sidebar for quick access.
Full Snowflake Query History in SELECT
For more info on this feature, check the announcement page.
AI Workload Summaries
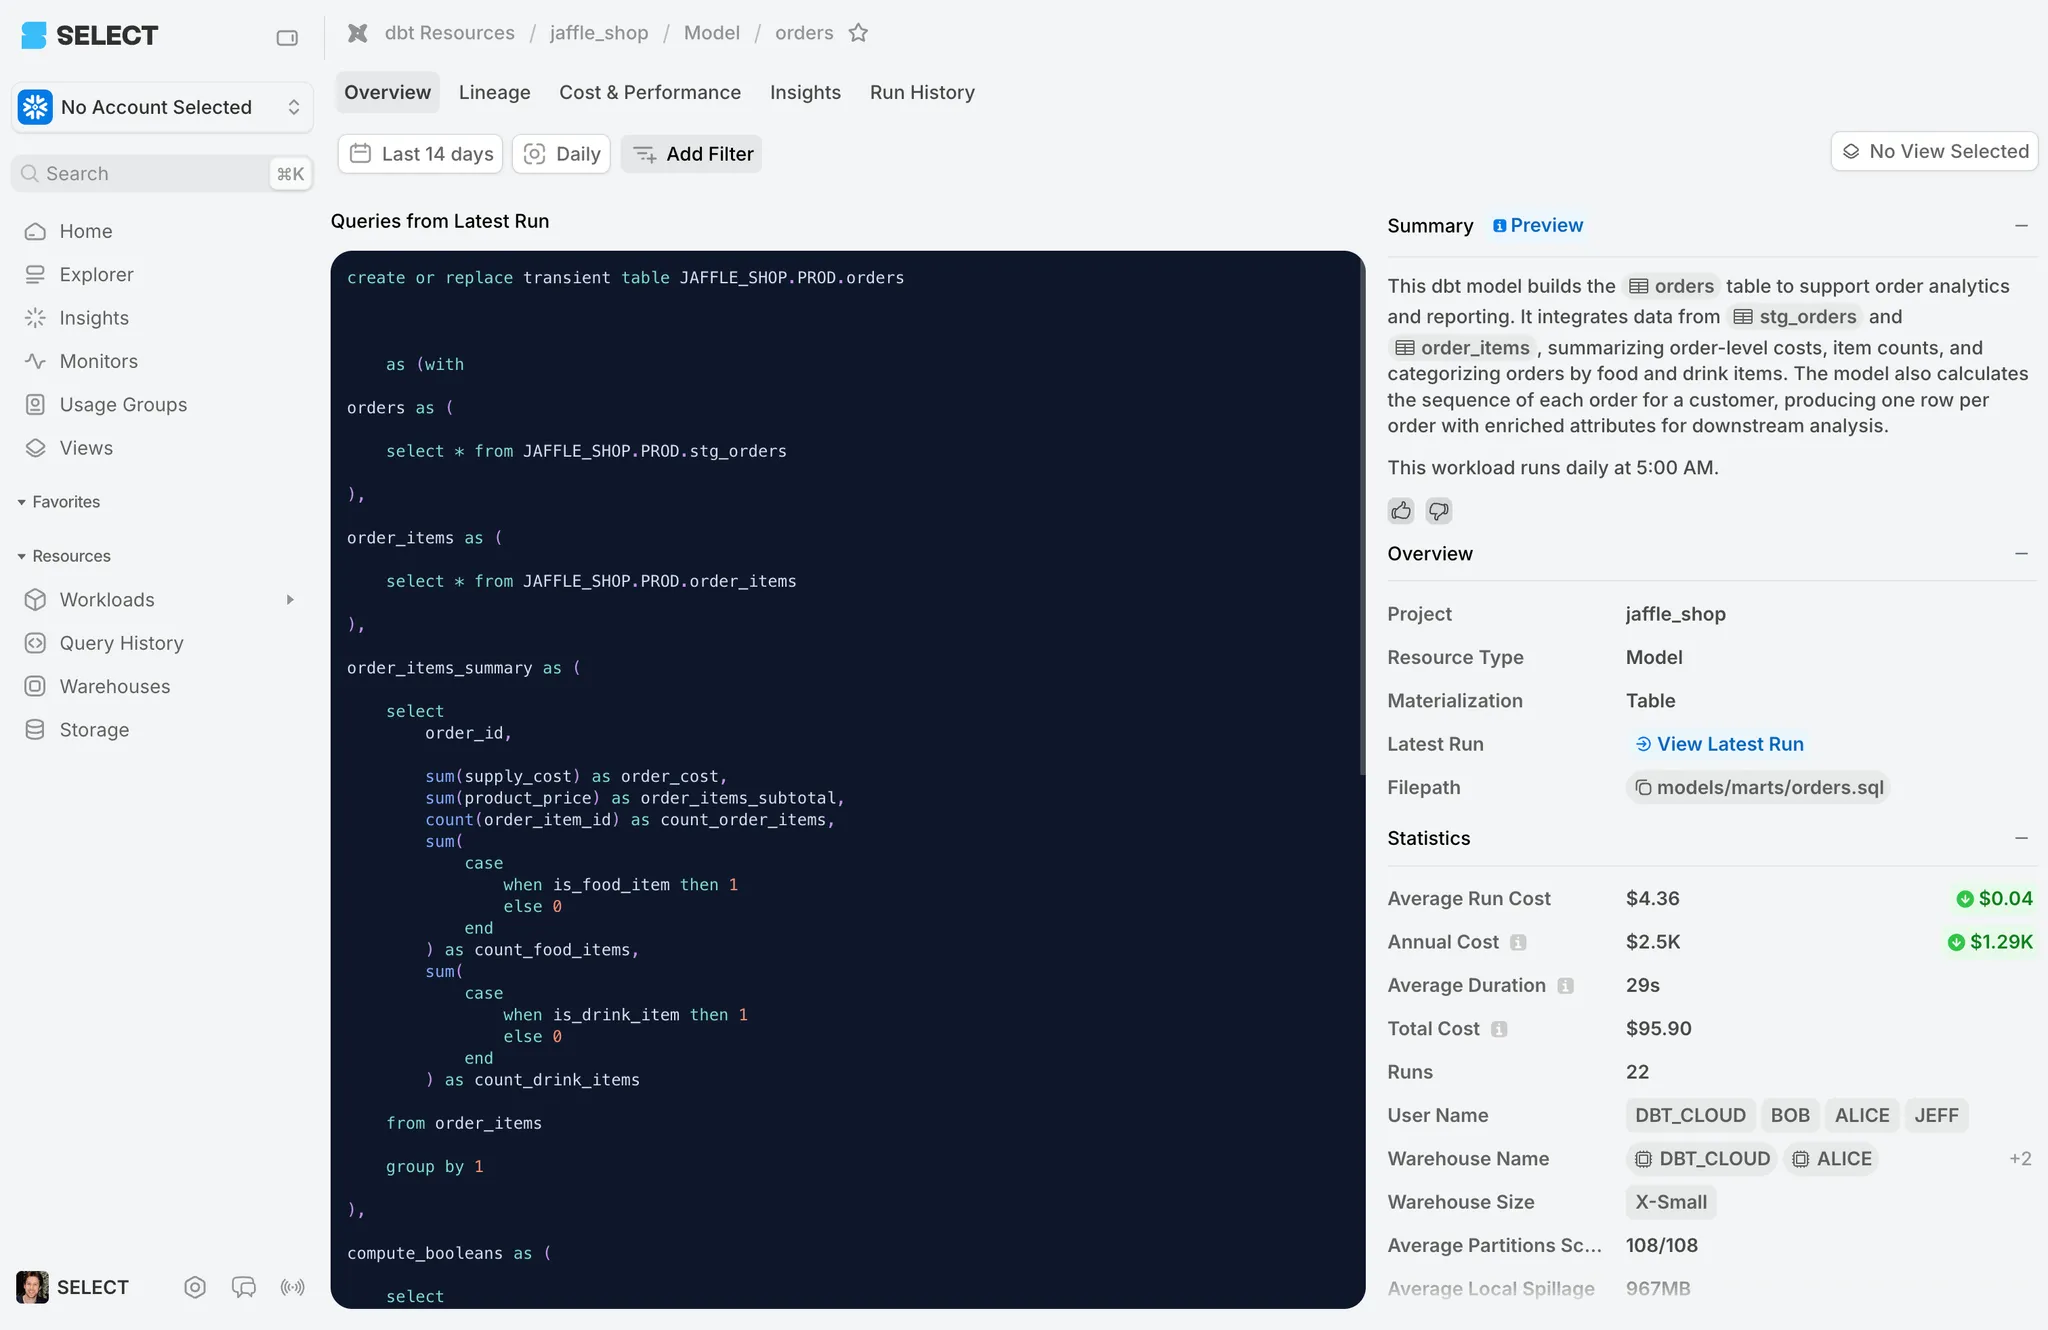
Building on the work we've done with AI query summaries, AI Workload Summaries will tell you about the important elements of a workload that are common across queries, such as query logic, key data sources, and run frequency.
The Workload Summaries have two main parts:
- Workload overview: Describes the overall theme and common elements of a set of queries belonging to the workload. The output will look familiar to people who have looked at query summaries.
- Run history: Describes the most common execution pattern of the workload in natural language. In cases where the workload runs in multiple environments, we limit scope to the one that most resembles production.
To see this in action, navigate to a workload page like the one below:
AI Workload Summary in SELECT
See the announcement page for more details on Workload Summaries.
Query Re-Write Suggestions
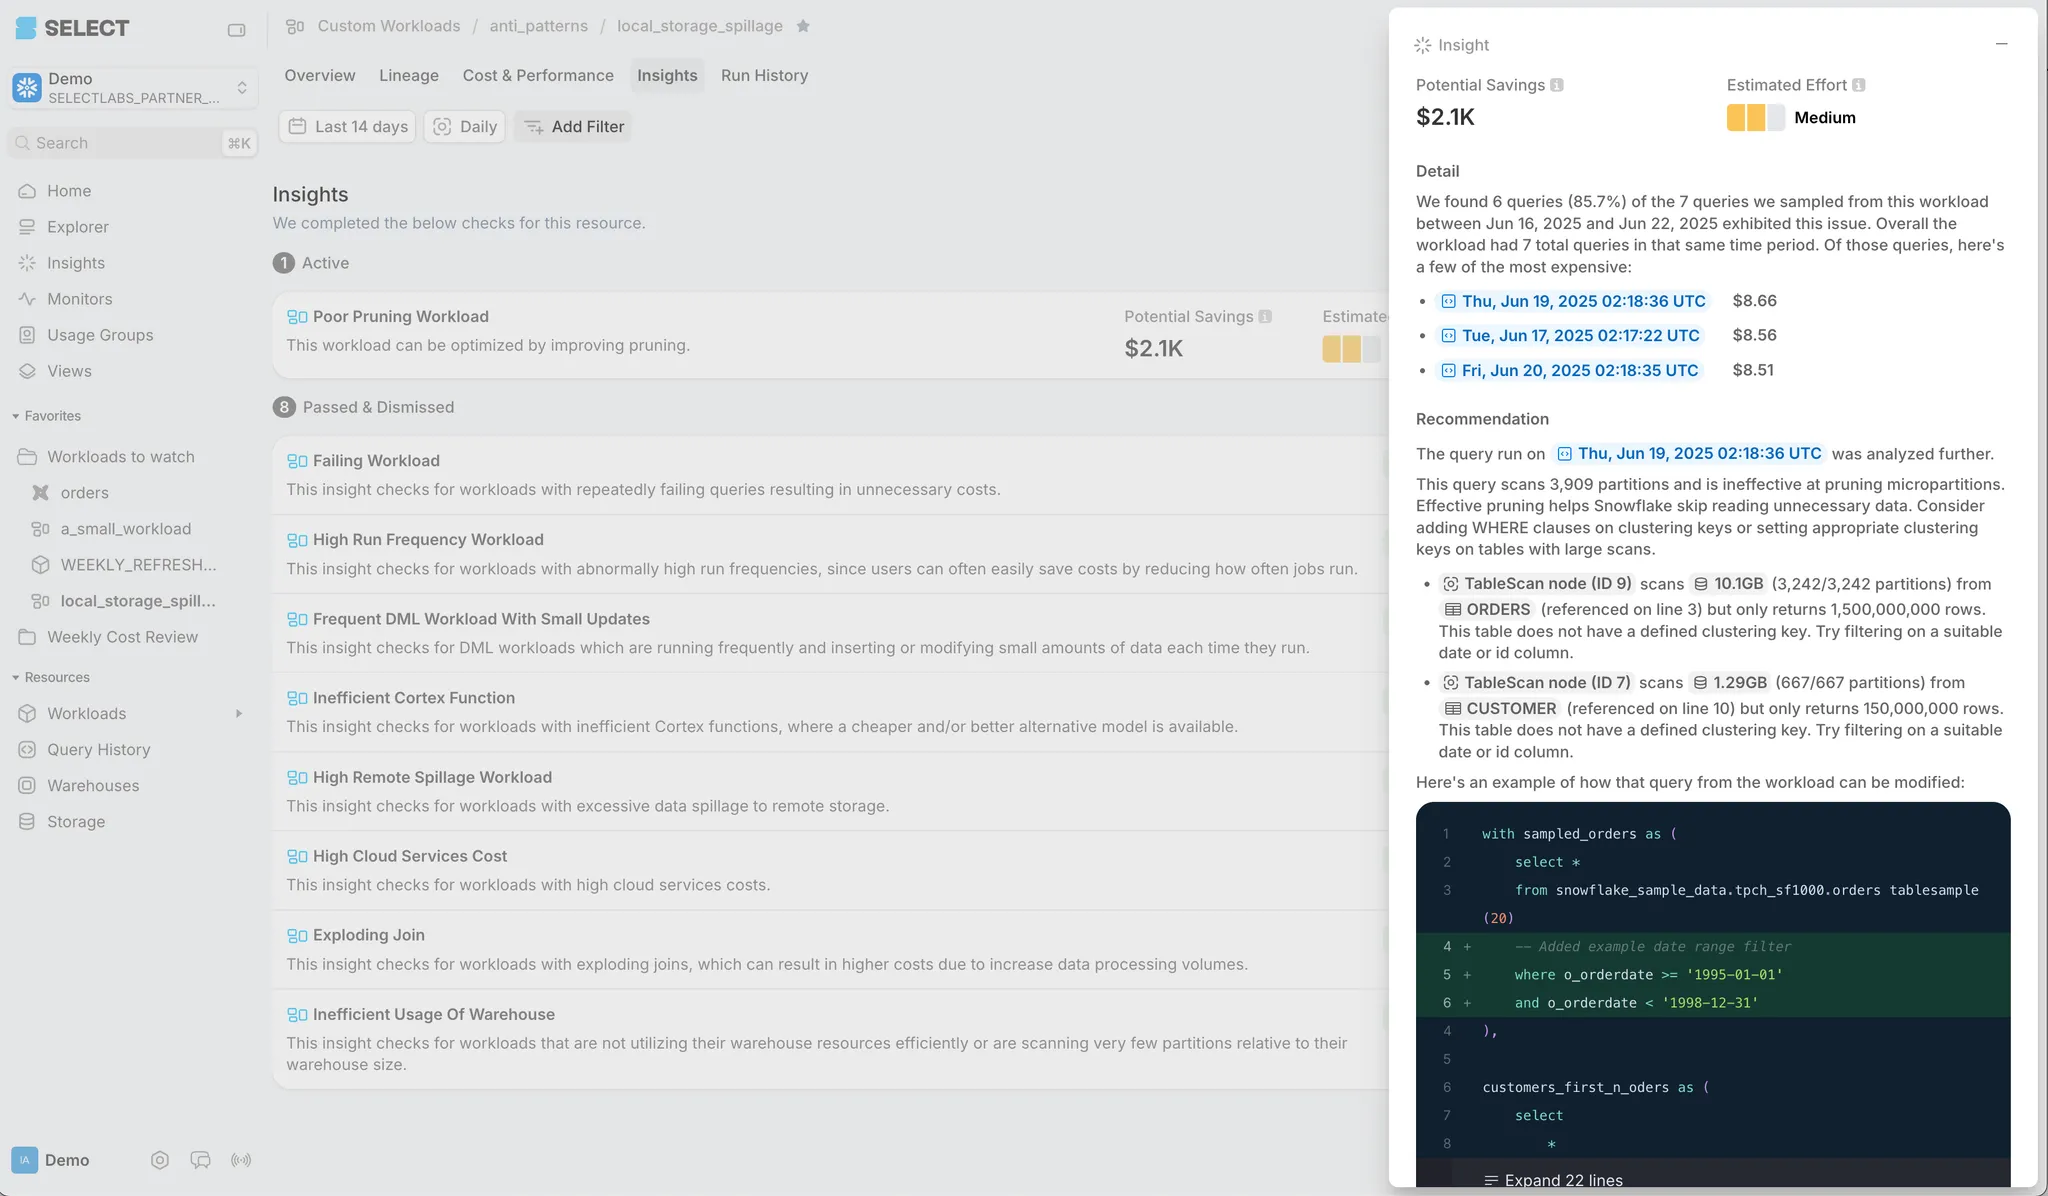
To help provide users with more actionable optimization insights, we’ve improved our Insights feature by adding suggested query changes. For example, if a workload is not pruning well (scanning too much data) we will share suggestions on how you can add filtering on high cost table scans to force query pruning.
These insights will be surfaced at both the workload level and on individual queries.
Other Releases
- Expanded support for Object Tags
- In-app updates and alerts
View the full list in our changelog.
As always, please feel free to message us in Slack/Teams with any questions or feedback! We'd love to hear from you.

Jeff is a Data and Analytics Consultant with 15+ years experience in automating insights and using data to control business processes. From a technology standpoint, he specializes in Snowflake + dbt + Tableau. From a business topic standpoint, he has experience in Public Utility, Clinical Trials, Publishing, CPG, and Manufacturing. Reach out any time, [email protected].
Want to hear about our latest data cloud learnings?Subscribe to get notified.
Get up and running in less than 15 minutes
Connect your Snowflake, Databricks, or BigQuery account and instantly understand your savings potential.

