

Announcing the new SELECT Query History!
Monday, June 09, 2025
 Ali Mohammad MehrProduct Engineer @ SELECT
Snowflake users commonly need to track queries from specific dashboards, models or other workloads. This week we've released the Query History tab on SELECT to address these common use cases.
The Query History tab provides cost information and shows which dashboards, workflows, and models initiated each query. You can apply various filters and view queries from the past year! Available filters on this page include:
- Tables/views a query accessed or modified
- Workload metadata (i.e. you can filter to all queries coming from a dbt model or Looker dashboard)
- Cortex AI models used
- And many others, including any other column available in the Snowflake Query History View
If you have sets of filters you commonly apply, you can save your view, and pin it to your sidebar for quick access!
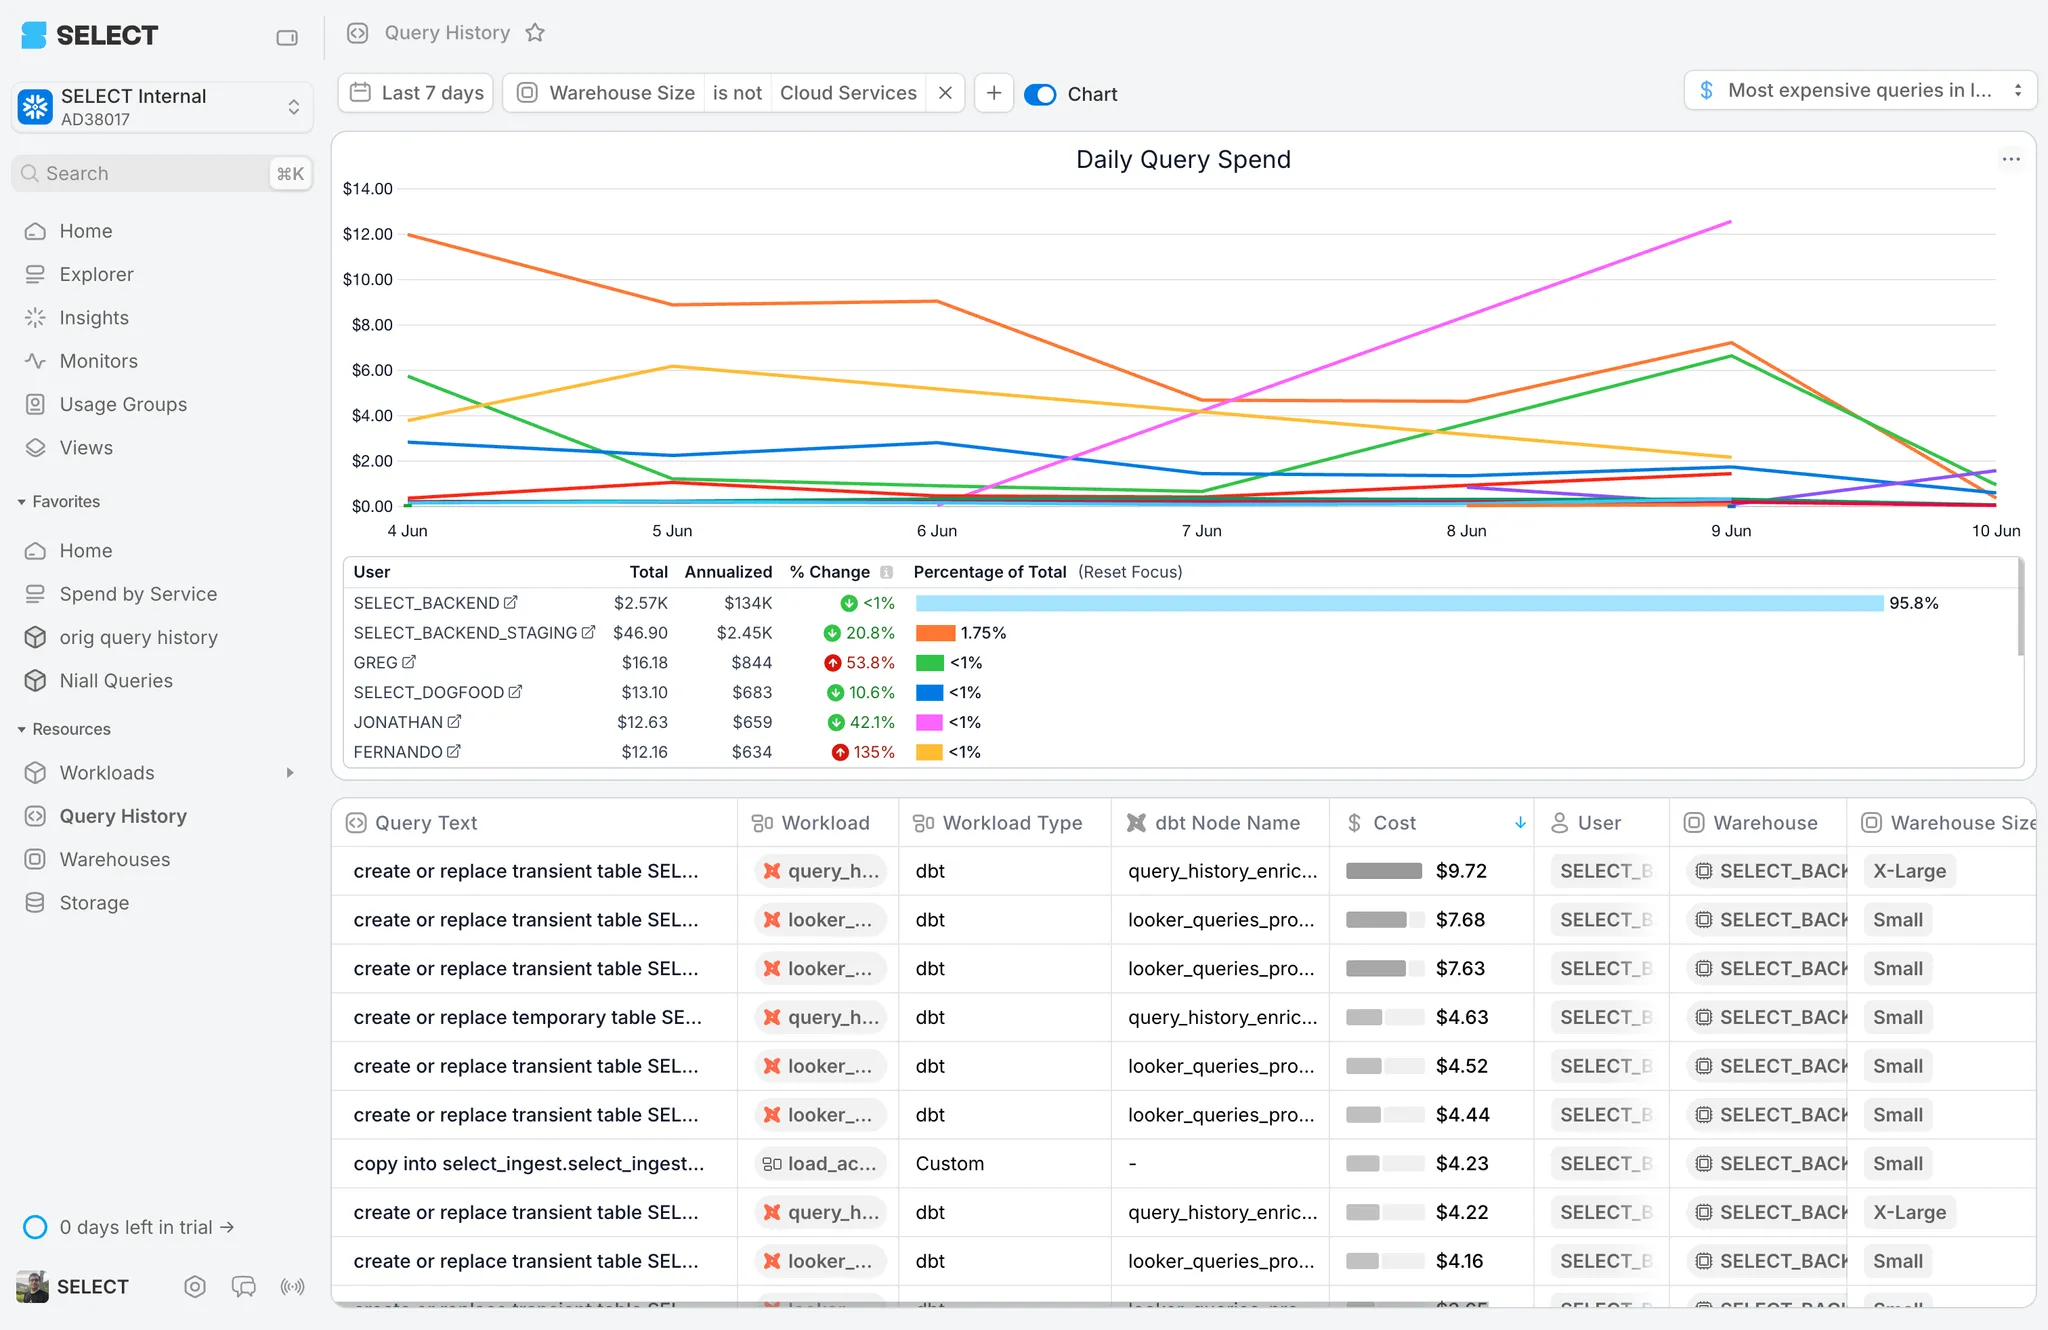
The chart on the Query History tab allows you to visualize cost and performance metrics, which you can break down by users, warehouses, and other dimensions.
For example, you could plot the average query response times for a given warehouse and a subset of your dashboards, and then save that as a view for monitoring purposes.
We hope you enjoy it!
Other Things We shipped
- 🚀 Use folders to organize your favourite pages and views on the sidebar
- 🪄 New sidebar layout for easier navigation
Up next.Previous Changelog Entries.