

SELECT offers a variety of tools to help you explore and understand your Snowflake spend. In this guide, we’ll walk through key areas you can investigate, including compute, storage, serverless usage, LLM costs, and more.
Scan the Home Page
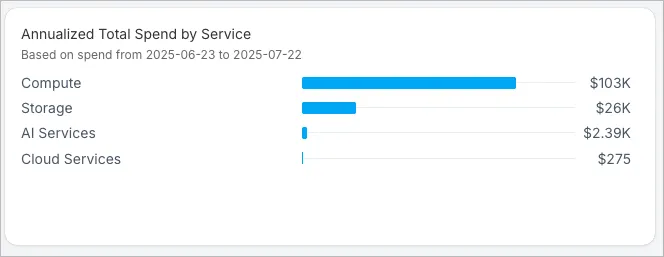
The Home page gives you a high-level overview of your entire account, breaking down spend across several dimensions, including:
- Total spend by service
- Potential savings by Insight category
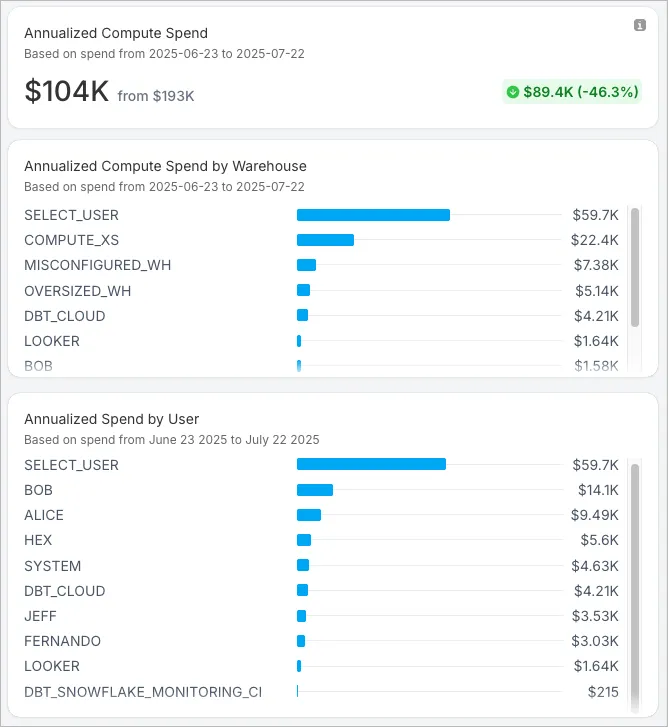
- Compute spend by warehouse and user
- Most expensive workloads
- Usage Groups (if configured)
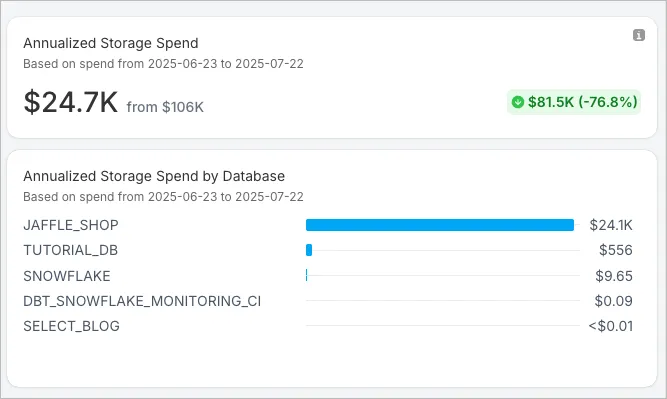
- Storage and serverless usage
- A summary of your automated savings
The bar charts and KPI tiles on the right side of the page offer helpful at-a-glance overviews of the various categories.
We recommend spending a few minutes exploring the home page, then move on to the more detailed pages such as Explorer and Workloads.
Using the Cost Explorer
The Cost Explorer is a great starting point for deeper analysis.
In the left sidebar, click Explorer. The default page shows you cost by Service, but you can easily change the primary dimension by clicking the button in the top right and change the “group by” using the ellipsis on the chart.
If you find specific explorer views helpful, you can save them as a view and pin to your sidebar for later reuse.
General Usage of Charts and Tables in SELECT
On the Explorer page, or any page with a chart or table, keep these tips in mind:
- Add filters in the top section.
- Click and drag in the chart to filter by date range.
- Clicking a bar chart item below the trend chart will temporarily filter the trend chart.
- The date grain (hour, day, month, etc.) and the “group by” (chart color breakout) can be changed using the ellipsis in the top right of the chart.
- Settings can be saved and favorited using the Save View button, then Favorite.
- Columns can be added to tables using the blue + sign on the right of any table.
- Columns can be removed by clicking the column header, then Hide.
- Columns can be re-ordered by dragging.
Drilling Down in Cost Explorer
In the table in Cost Explorer (and many tables on other pages), click any name in the left column to drill into that resource. For example, drill into Compute to view warehouses, then into a warehouse to see workloads.
Deep Dive on Compute Costs
A good way to focus on compute costs is to study the most expensive workloads in your account. Click Workloads → All Workloads (or pick a specific Workload Type) in the sidebar. The default chart layout will display by Workload Type, for example Query Pattern, dbt, Task, Custom Workload, etc. If you’d like, you can change this to show by Warehouse, Usage Group, Role, User, etc.
Like most pages in SELECT, you can filter by nearly any attribute, including query type, cost category, timing, resources, and more.
The table will be sorted with your most expensive Workloads on top. Drill into these Workloads by clicking on the name in the left column. Here’s an example of how I can explore our most expensive dbt model to gain some insights:
Exploring Storage Costs
To explore Storage costs in SELECT, use the Storage page in the sidebar. The navigation and exploration pattern is similar to other pages. By default, you'll see data by database, and you can switch to Schema or Table using the tabs at the top.
Finding Unused Tables
One common thing we like to look at is unused tables. To find unused tables, you can add a filter: Data Access → Last Query Date → is before → pick a date.
You can also add a few helpful columns to your table to analyze the impact of dropping a table or eliminating an ETL process:
- Annual Write Query Cost
- Annual Read Query Cost
- Number of Users
- Users
SELECT comes with a default View for Unused Tables, but we thought it would be helpful for you to see how to create a similar from scratch.
Exploring Cortex LLM Costs
The best place to find Cortex Cost is also on the Workloads page.
- Click Workloads → All Workloads.
- Change the chart metric to Cortex Function Cost (type Cortex in the search).
- Change the Group By to Cortex Function Name or Cortex Model.
- Add a column to the table: Cortex Function Cost.
- Sort by that column.
- Drill down on the workloads (click the name in the left column) to learn more.
Don’t forget to save this View and favorite it!
At this time SELECT doesn’t support cost exploration for Cortex Analyst or other AI services, but we will in the future.
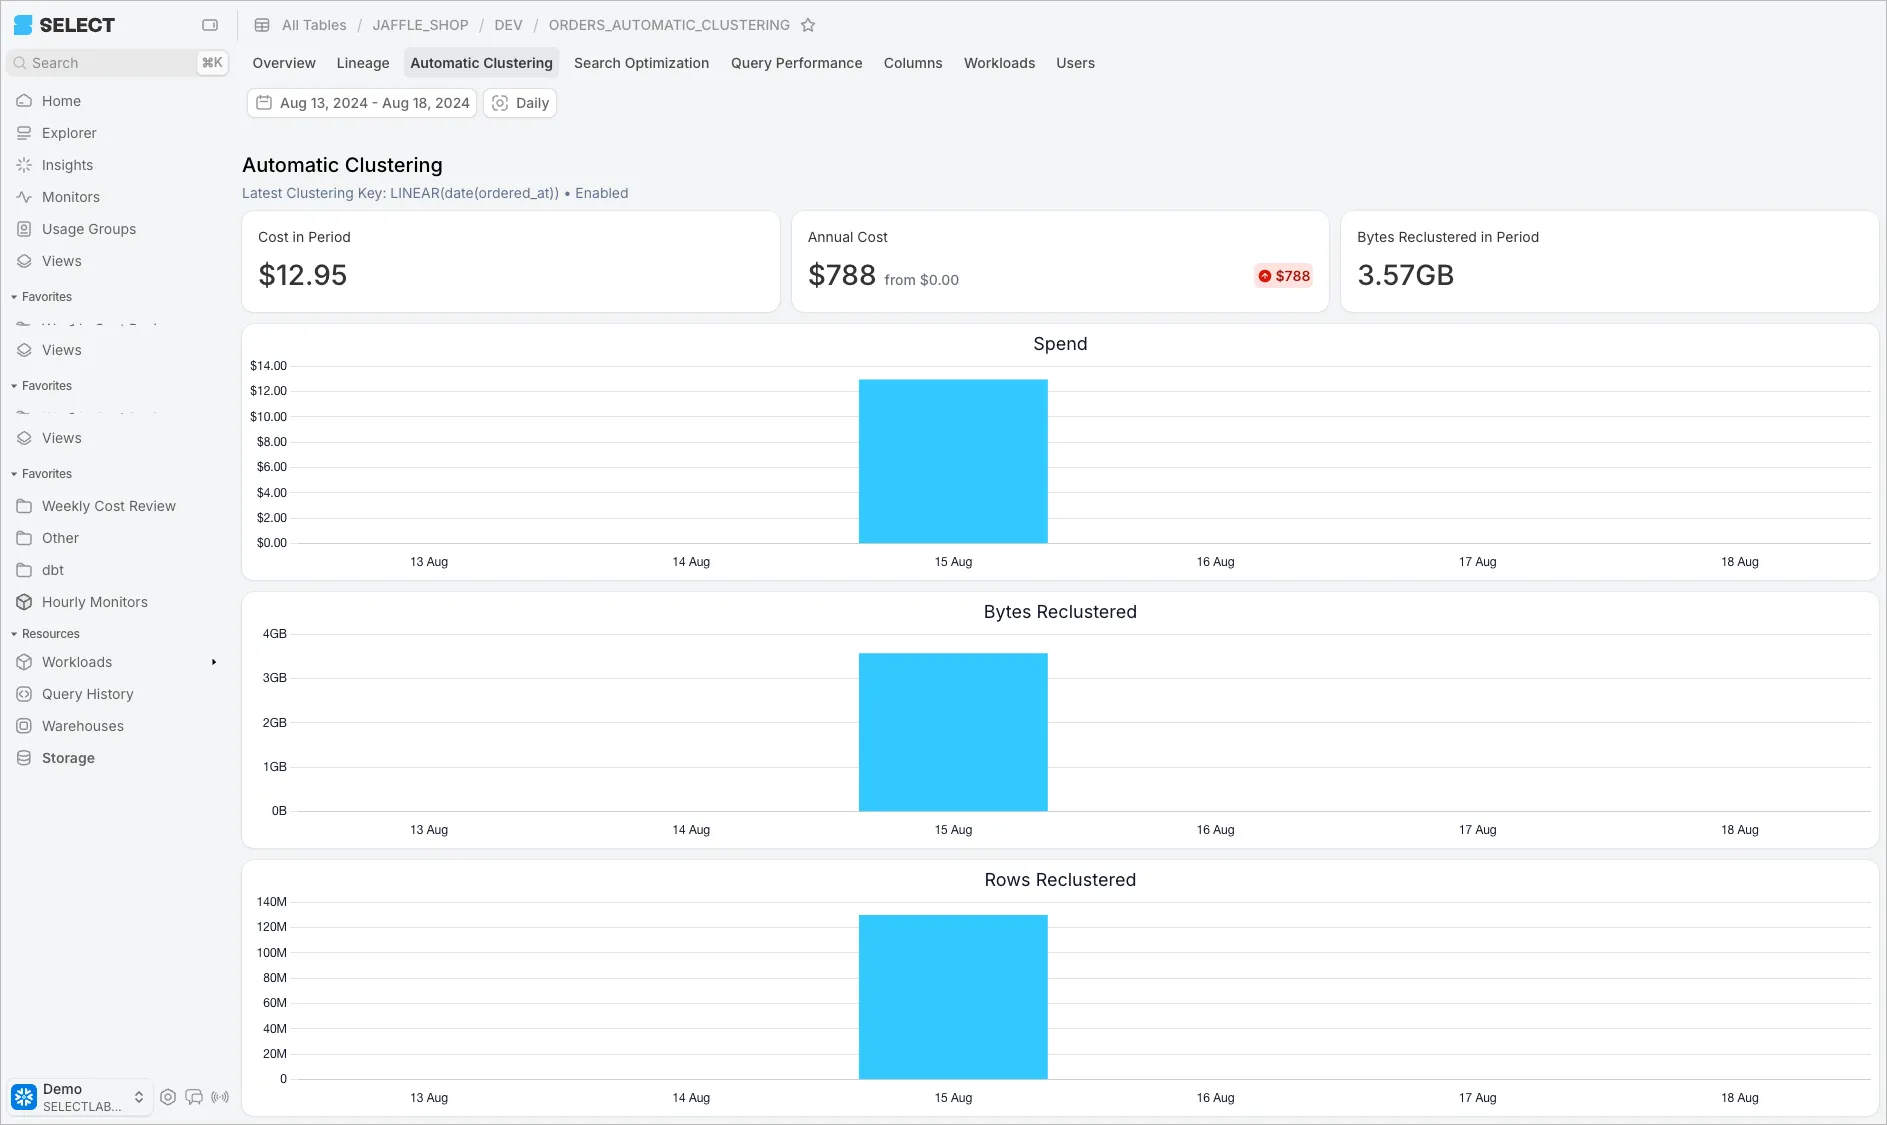
Explore Serverless Costs
To explore Serverless costs, click Workloads → Serverless in the sidebar. The default chart grouping is by “Type”, where you can find Automatic Clustering, Snowpipe, Serverless Tasks, QAS, Search Optimization Services, to name a few.
The exploration pattern here is much the same. Apply any filters / add any columns you’d like. Then drill down by clicking the item in the Name column.
Lineage
Another powerful way to explore cost in SELECT is via the Lineage tab. Our Usage Guide on Identifying Optimization Opportunities covers using lineage, so please refer to that article.

