In SELECT, it's common to apply the same filters or add the same columns each time you use the app. Views are a powerful feature that lets you save your filter and column configurations. They make it easy to build a repeatable cost review ritual by creating and reusing Views that highlight what matters most.
Explore default views
SELECT comes with a few default Views. Click “Views” in the sidebar. On this page, any View created by SELECT is considered a default View. In this screenshot, I’ve filtered on the “Created By” field to show the default views:
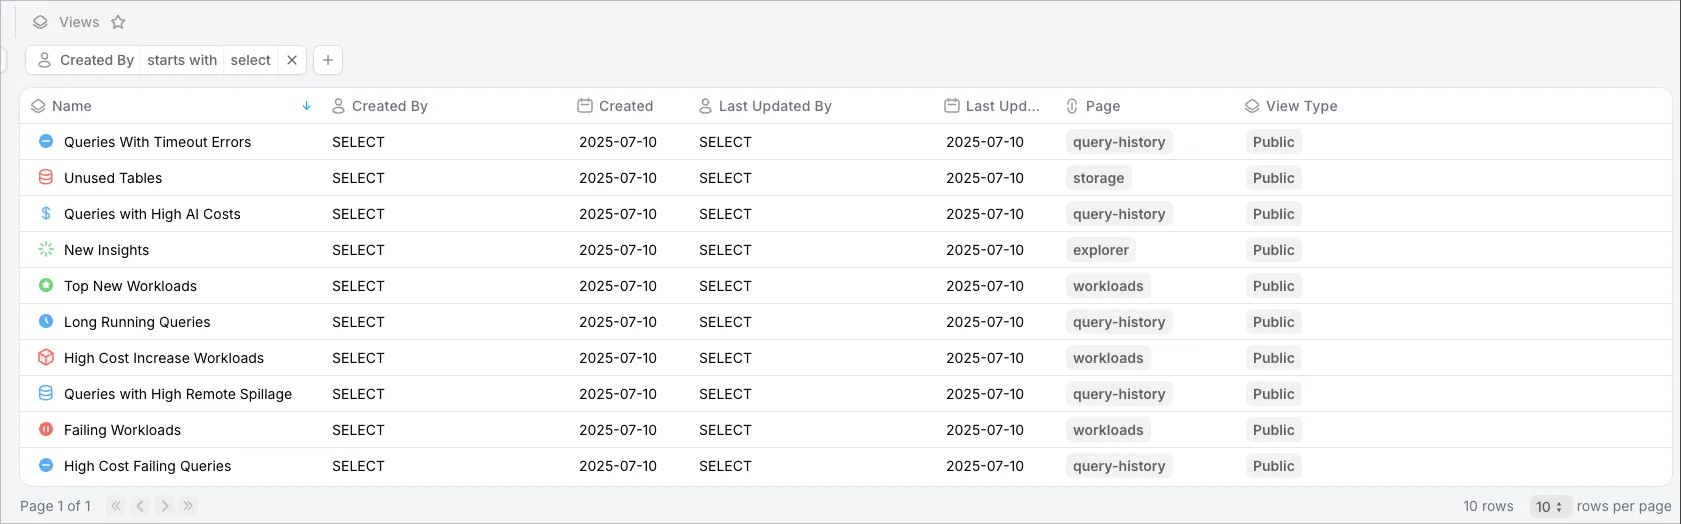
This can serve as a starting point for cost reviews. You can easily modify these default Views by clicking into one, changing the filters (or column set), then clicking “Update For Everyone” in the top right.
For example, maybe you want to reduce the number of rows returned in the “Failing Workloads” view by filtering to a higher number of Failed Executions. Simply add a filter for “Failed Executions > 10” and the noise will be reduced.
Create a weekly cost review folder
You can pin your favorite Views to the sidebar using the Favorites feature and organize them into folders for easy access. Let’s create a “Weekly Cost Review” folder and add these default views to the folder:
- Top New Workloads
- Failing Workloads
- New Insights
- High Cost Increase Workloads
Here are the steps:
- First, hover near “Favorites” in the sidebar until a + Folder icon appears. Click it to create a new folder named “Weekly Cost Review”.
- Go to the Views page (sidebar).
- Click “Top New Workloads”.
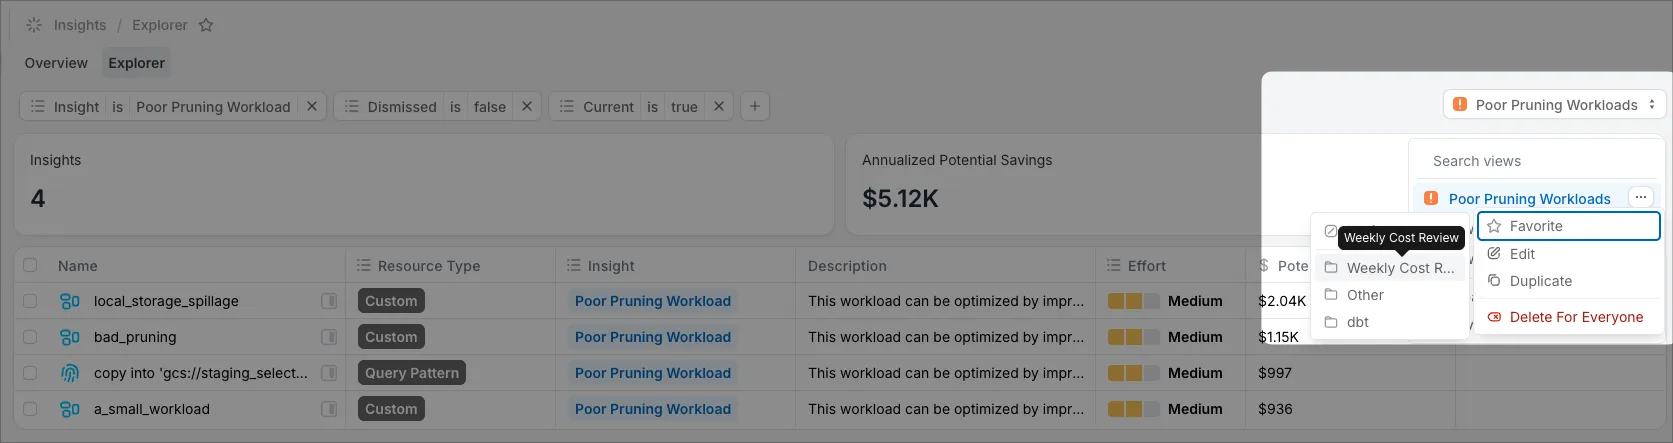
- Now in the top right you will see the “✮ Top New Workloads” displayed in a drop down menu. Click that drop down, then click the ellipsis (three dots) next to “✮ Top New Workloads” and select Favorite. From this context menu you can add it directly to the folder.
- Observe the new Favorite item in your new folder.
- Repeat steps 2-6 for the other three views we want to add to this folder.
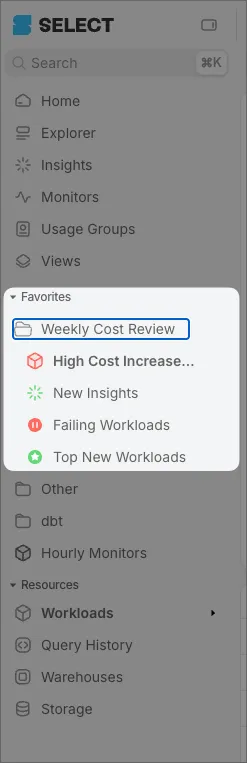
The end result should look like this:
Create New Views
Let’s create two new Views and add them to our Weekly Cost Review folder.
Workloads with Poor Pruning Efficiency
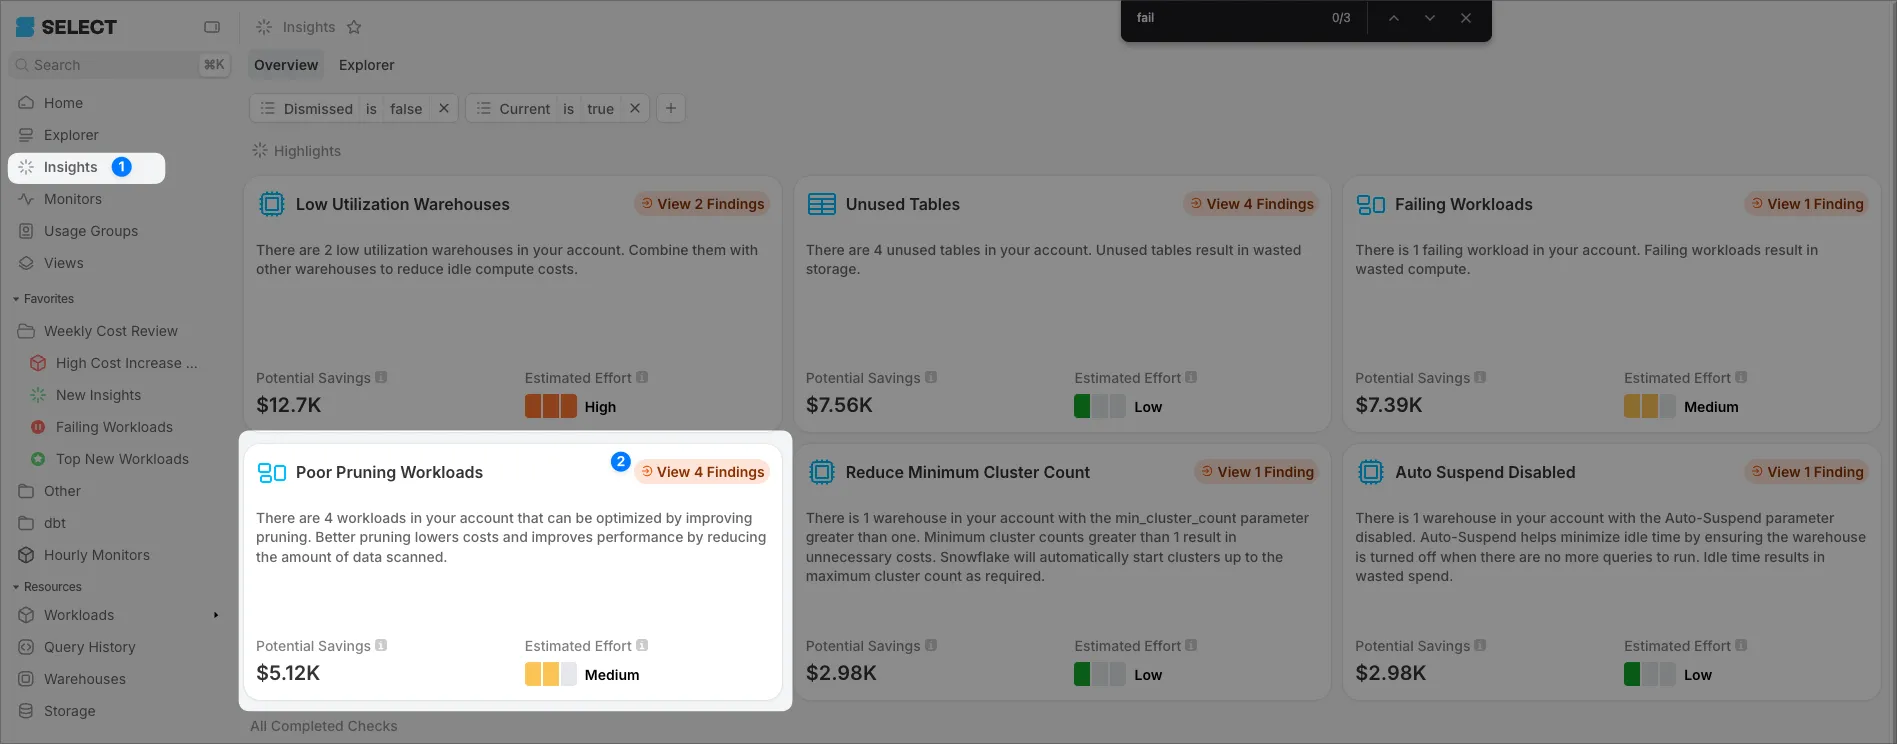
To find queries that execute full table scans, click Insights on the sidebar, then click View Findings on the Poor Pruning Workloads card.
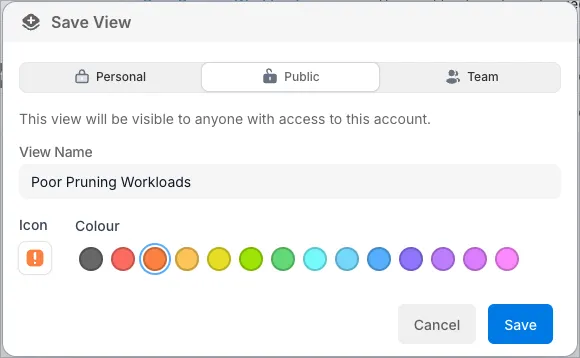
On the subsequent page you will find the “Save View” button in the top right. Click Save View, name it “Poor Pruning Workloads,” make it public, and add it to the Weekly Cost Review folder.
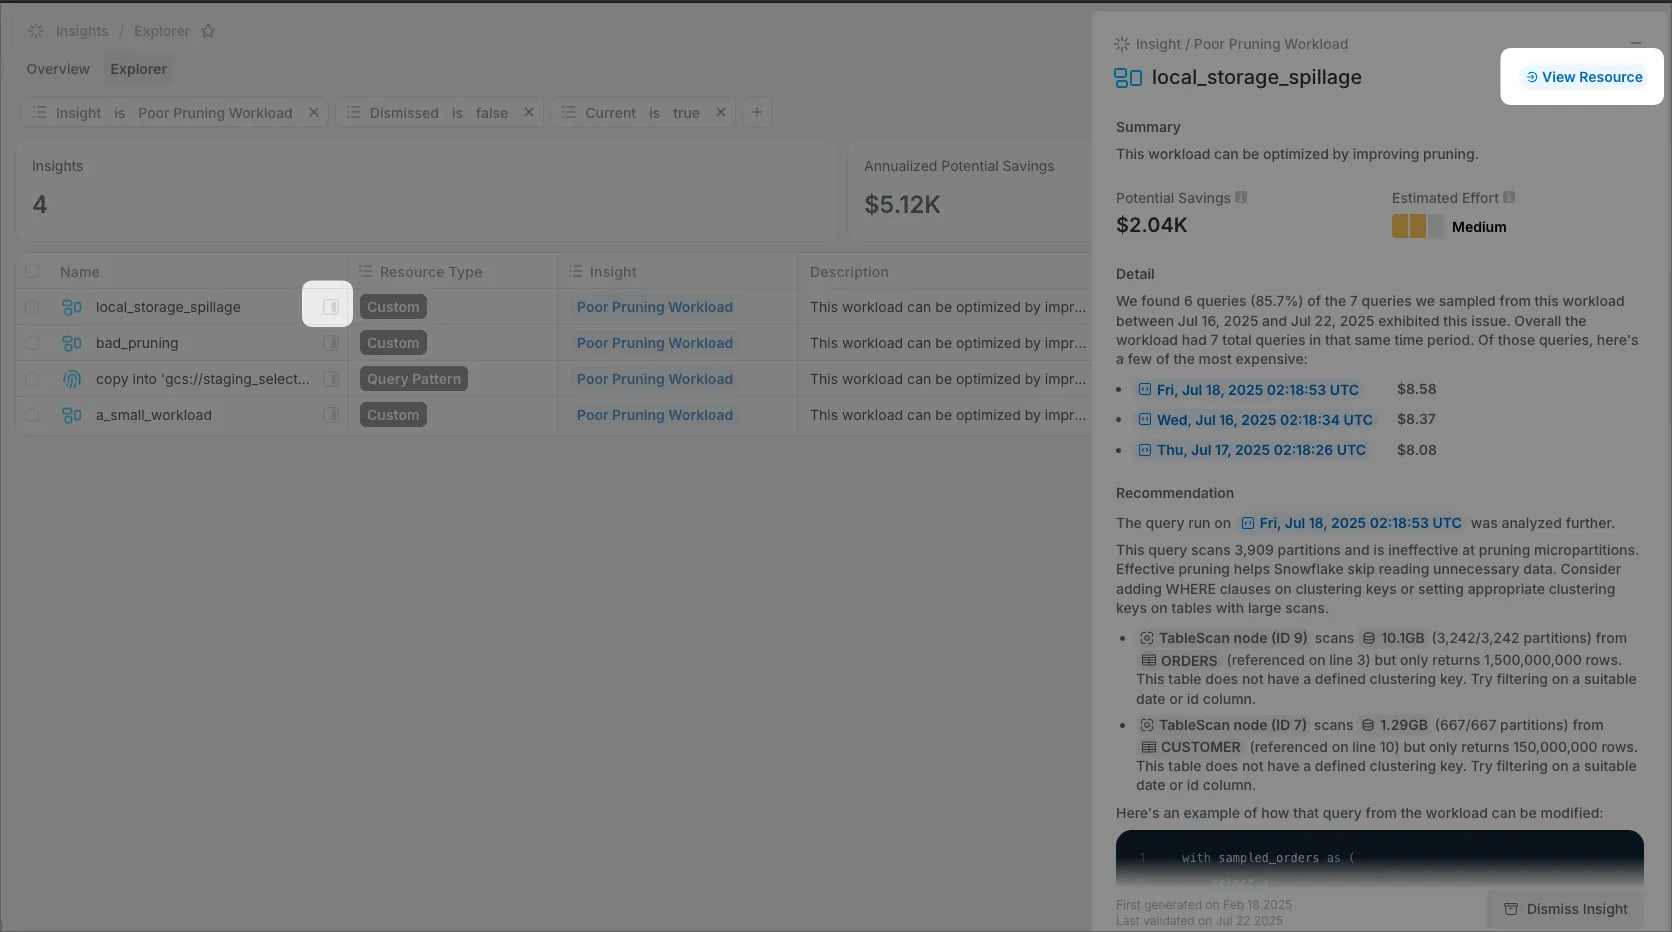
To drill into any of these workloads, click the Side Peek button, then click View Resource in the side drawer.
Queries Accessing a Specific Table
Let’s say we want to monitor all workloads accessing a specific table. This is commonly done to monitor performance when making changes to clustering keys. SELECT makes it easy to monitor this behavior, but requires Enterprise Edition of Snowflake. Here are the steps.
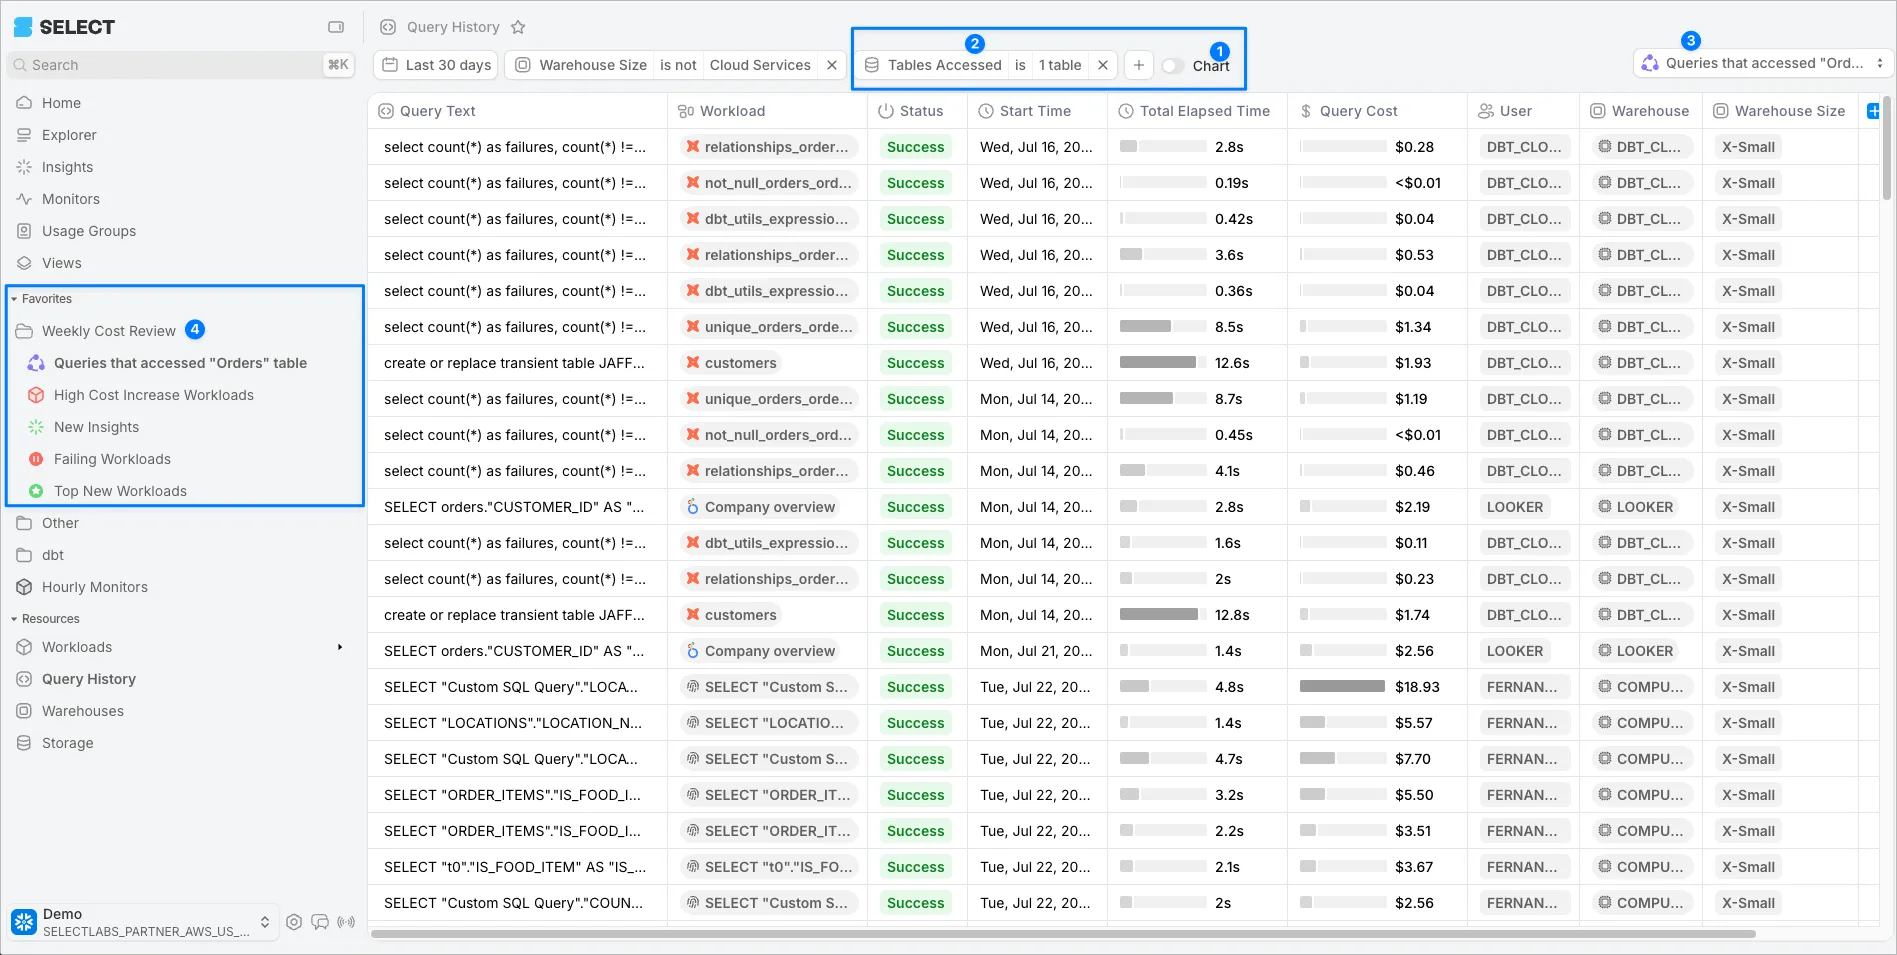
- Go to Query History in the sidebar.
- Optional: Hide the chart by clicking the Chart Toggle.
- Add a filter using the + filter button: Tables Access → is → then search for a specific table. I’ll use our most popular table, Orders.
- Save the view and add it to the Weekly Cost Review folder.
Here is the final result, including the updated sidebar: