

Feature overview
The SELECT dbt integration allows you better understand and optimize Snowflake spend attributed to dbt.
- Dissect your dbt spend across a variety of different dimensions such as project, target, materialization and resource type.
- Identify expensive models and tests, and understand how their cost and performance varies over time.
- Drill into the execution history of any dbt resource and view query profile diagnostics for each run.
- Receive tailored optimization recommendations to improve model cost and performance
dbt model timing chart
With SELECT's dbt integration, you can also understand the performance of each dbt run with our model timing chart, located on the Timeline tab of each dbt run page:
A great feature of this chart is you can click straight into a given model's run to understand why it took the time it did using our version of the Snowflake query profile:
dbt runs view
Understand the performance and cost of your dbt project over time using the dbt runs view. Filter for specific commands, targets, users and more. Click into individual runs in the table or chart to view more detail and access the timing chart.
Setup
SELECT uses query tags and comment metadata to power this integration. To enable this integration, follow the configuration steps below.
Step 1: Update packages.yml
Add the following entry to your dbt project's packages.yml file in the root of the dbt project, creating the file if it doesn't exist:
Step 2: Adding the query tags
Configure the dispatch search order in dbt_project.yml.
Step 3: Configure the query comments
Add the following config to dbt_project.yml.
That's it! All dbt-issued queries will now be tagged.
Example dbt query metadata
This configuration adds metadata describing each dbt-issued query to a tag on the query. Once enabled, SELECT will begin to provide insights, analytics and recommendations on your dbt project. An example of the metadata added to each query is shown below:
Step 4: All done!
That's all that's required for setup. The next time your dbt project runs, the generated queries will automatically be tagged with this metadata. SELECT will then process this query metadata and present it back to you in the web application.
Leveraging dbt meta & tags
Consider the example dbt_project.yml below, which implements a combination of dbt meta fields and tags.
The file structure for this dbt project would look something like what is shown below. All resources under the engineering directory would be get a team meta field added with the value engineering. Similarly, the one model in the forecasts directory would get a team field of finance added. It would also have tags: ["sensitive", "critical"].
If you would like to set meta per model instead of per folder or "resource path", here is how you would do that:
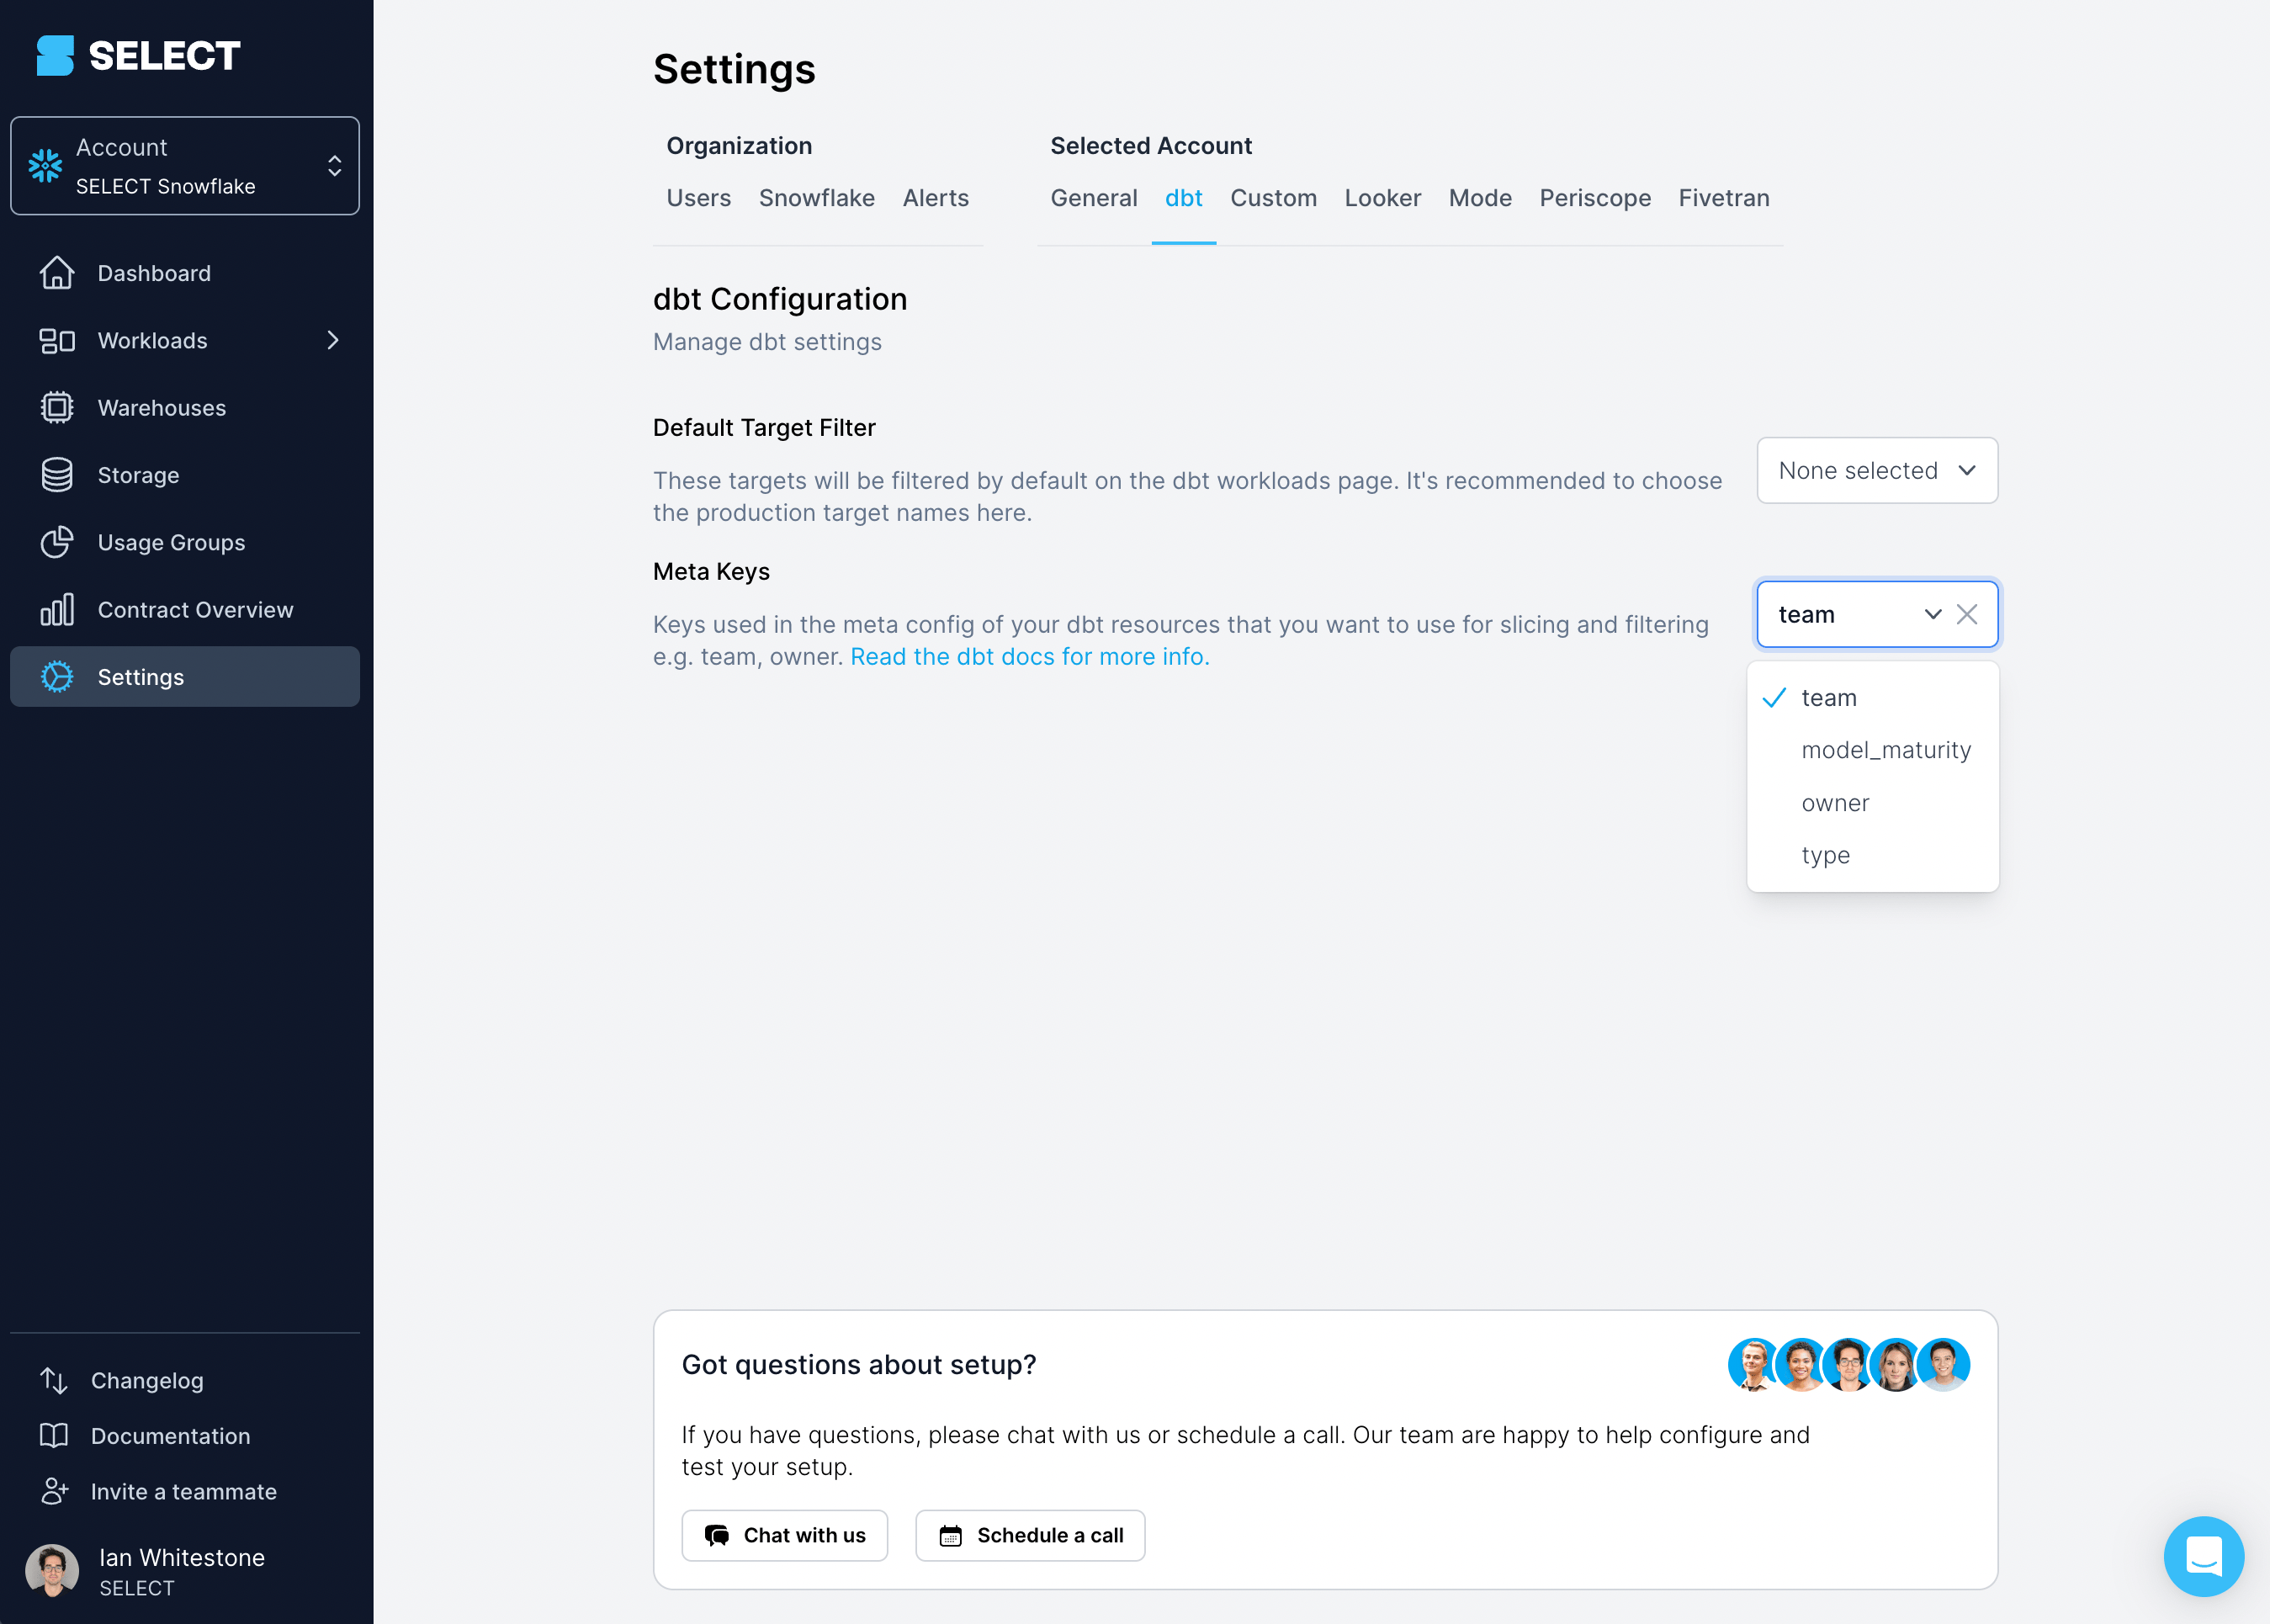
To expose dbt meta fields in SELECT, head to the dbt settings and specify which fields you'd like to filter on. No such specification is required for dbt tags.
Once added, you can filter and slice by this metadata throught the UI!
Looking to do cost chargebacks or showbacks using dbt metadata? You can now flexibly allocate costs using dbt meta fields and tags you've specified using SELECT's Usage Groups feature!
Accessing the dbt query metadata
If you would like to access the dbt query metadata created by our dbt package, you have two options.
Option 1: Snowflake Query History
You can access the dbt query metadata by parsing the query comments/tags our package adds by querying the Snowflake query history. Here is an example SQL script you can run in your account:
Option 2: Via a data share
All data visible in the SELECT web application can be accessed through a secure data share, including a table named dbt_queries which includes all of the metadata (and more) shown above. See our data sharing documentation for more details.

