In this guide, we will explain the primary ways users can find optimization opportunities in SELECT.
Method 1: Use Insights
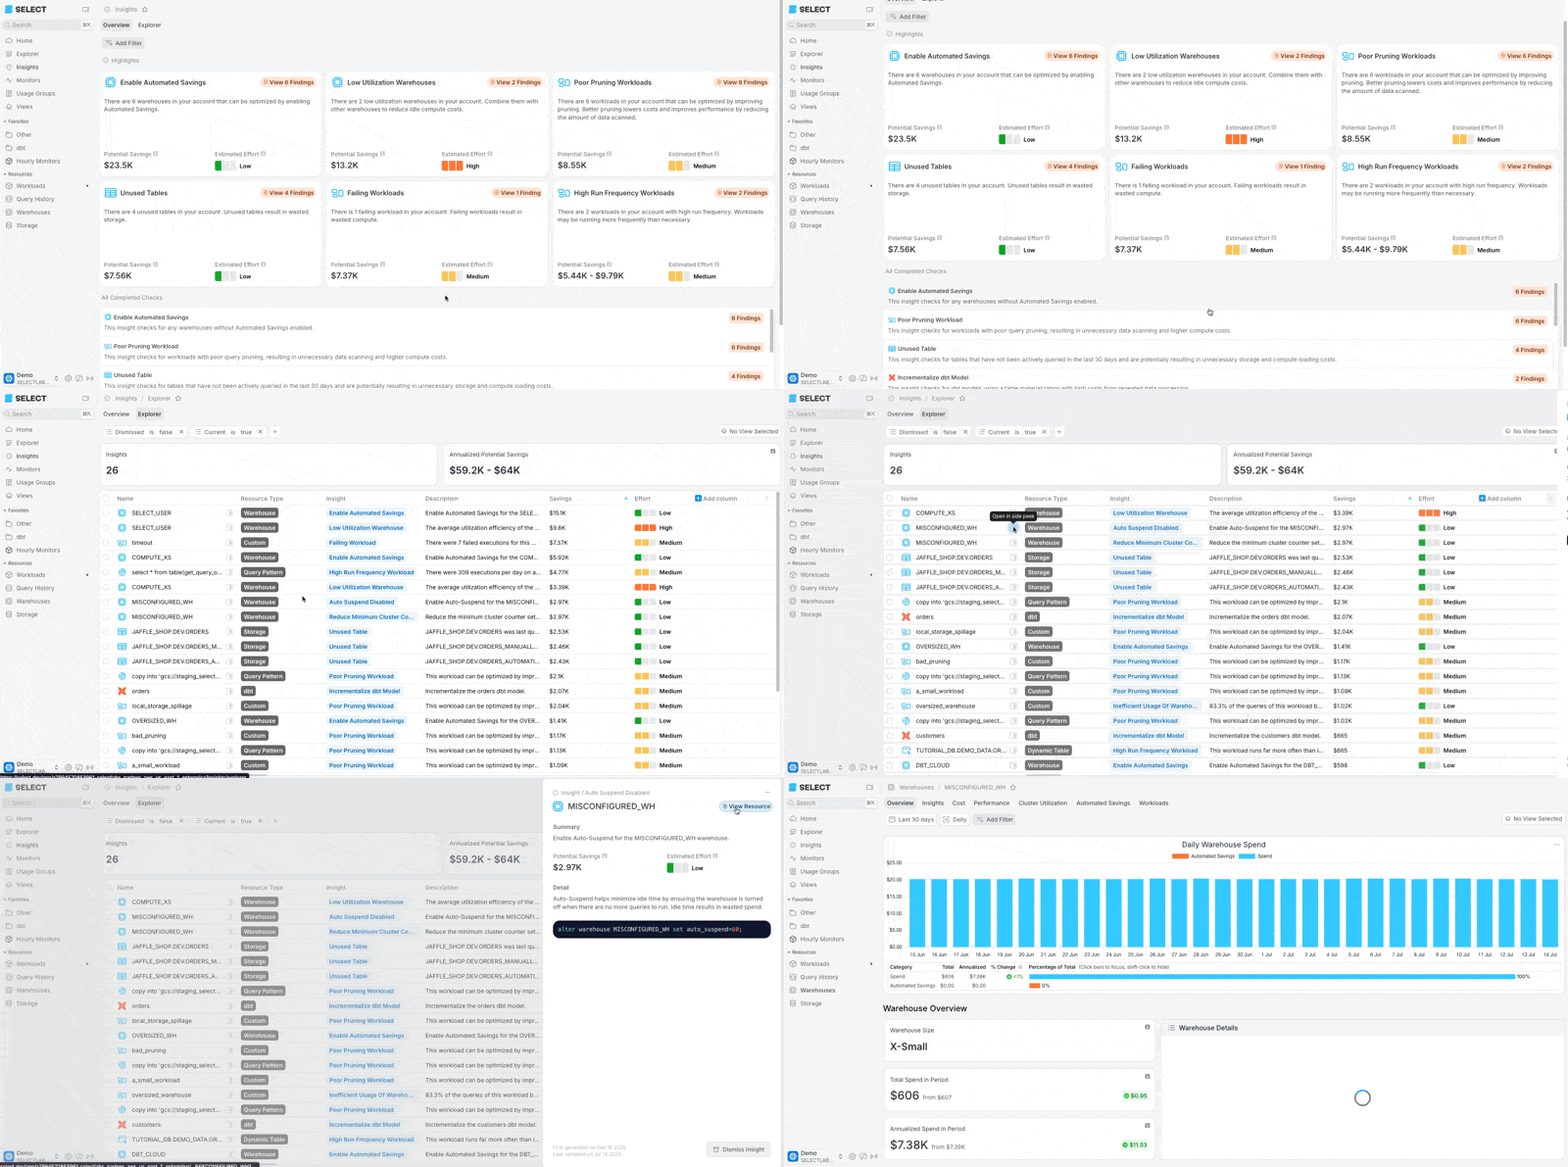
The easiest way to find optimization opportunities in SELECT is from the Insights page found in the left sidebar. Here you’ll get an overview of 6 highlighted insight categories with the ability to drill into each category by clicking the reddish-orange ‘View Findings’ button. Or, you can view all findings in the Explorer tab at the top. Let’s walk through how to explore these.
Exploring Insights by Category
On the main Insights page, you’ll find 6 categories of insights that you can explore one at a time. For example, let’s click the “View Findings” button on the “Enable Automated Savings” card.
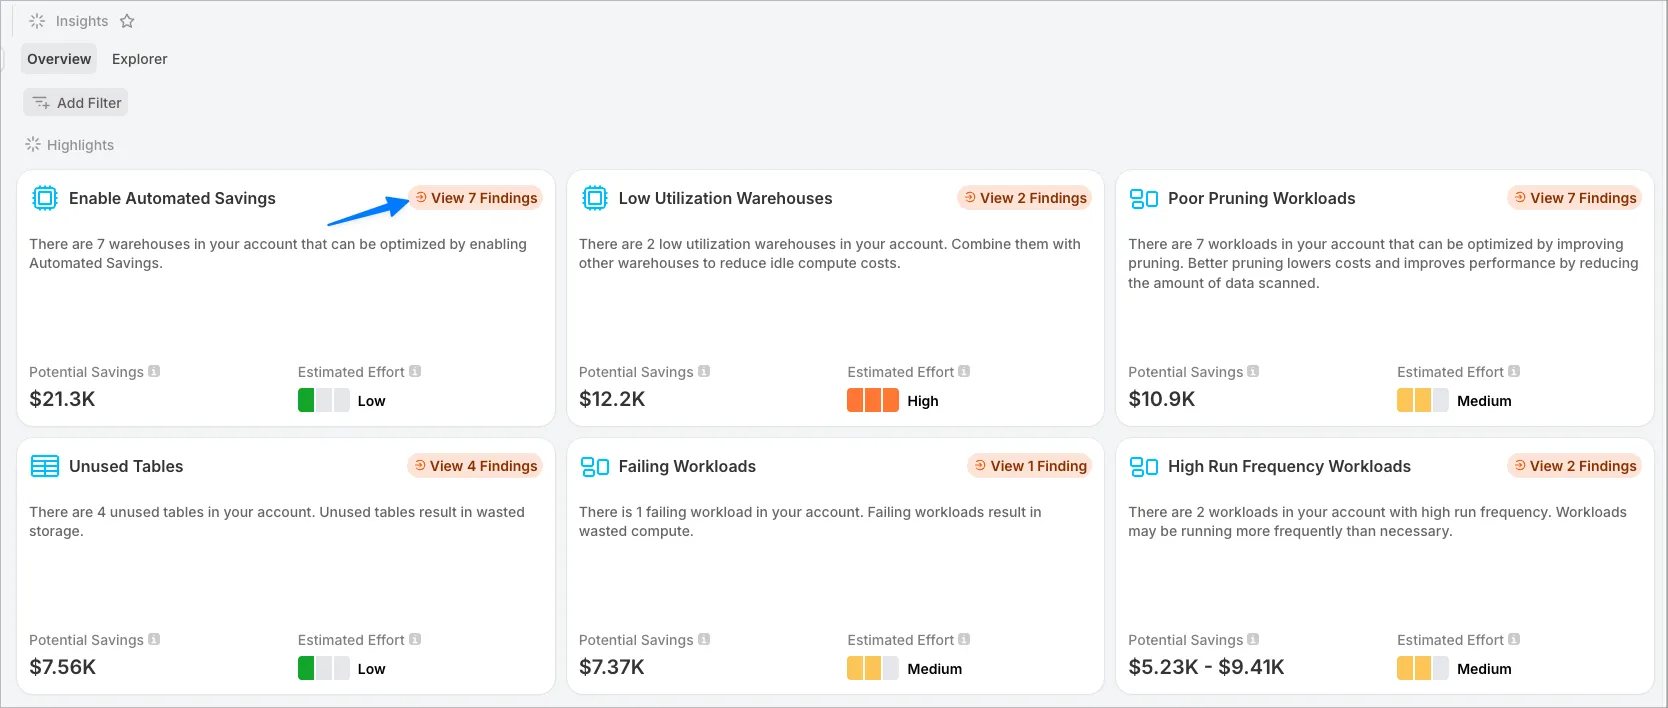
The subsequent page will show each insight. In this case, it highlights warehouses where the Automated Savings feature can be enabled. The Side Peek button will give more info.

Let’s walk through one more insight category. Click “High Run Frequency Workloads” insight category:
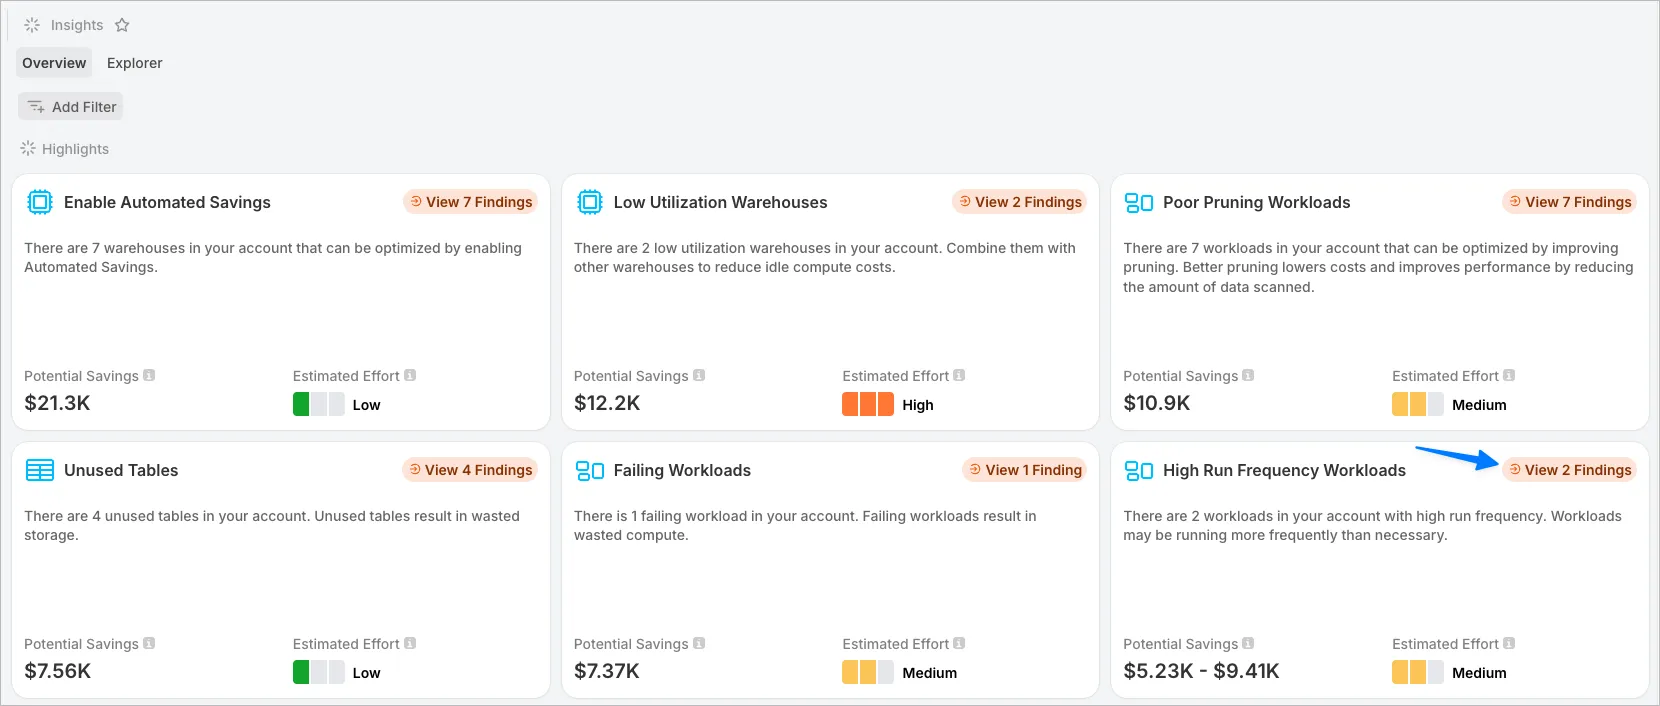
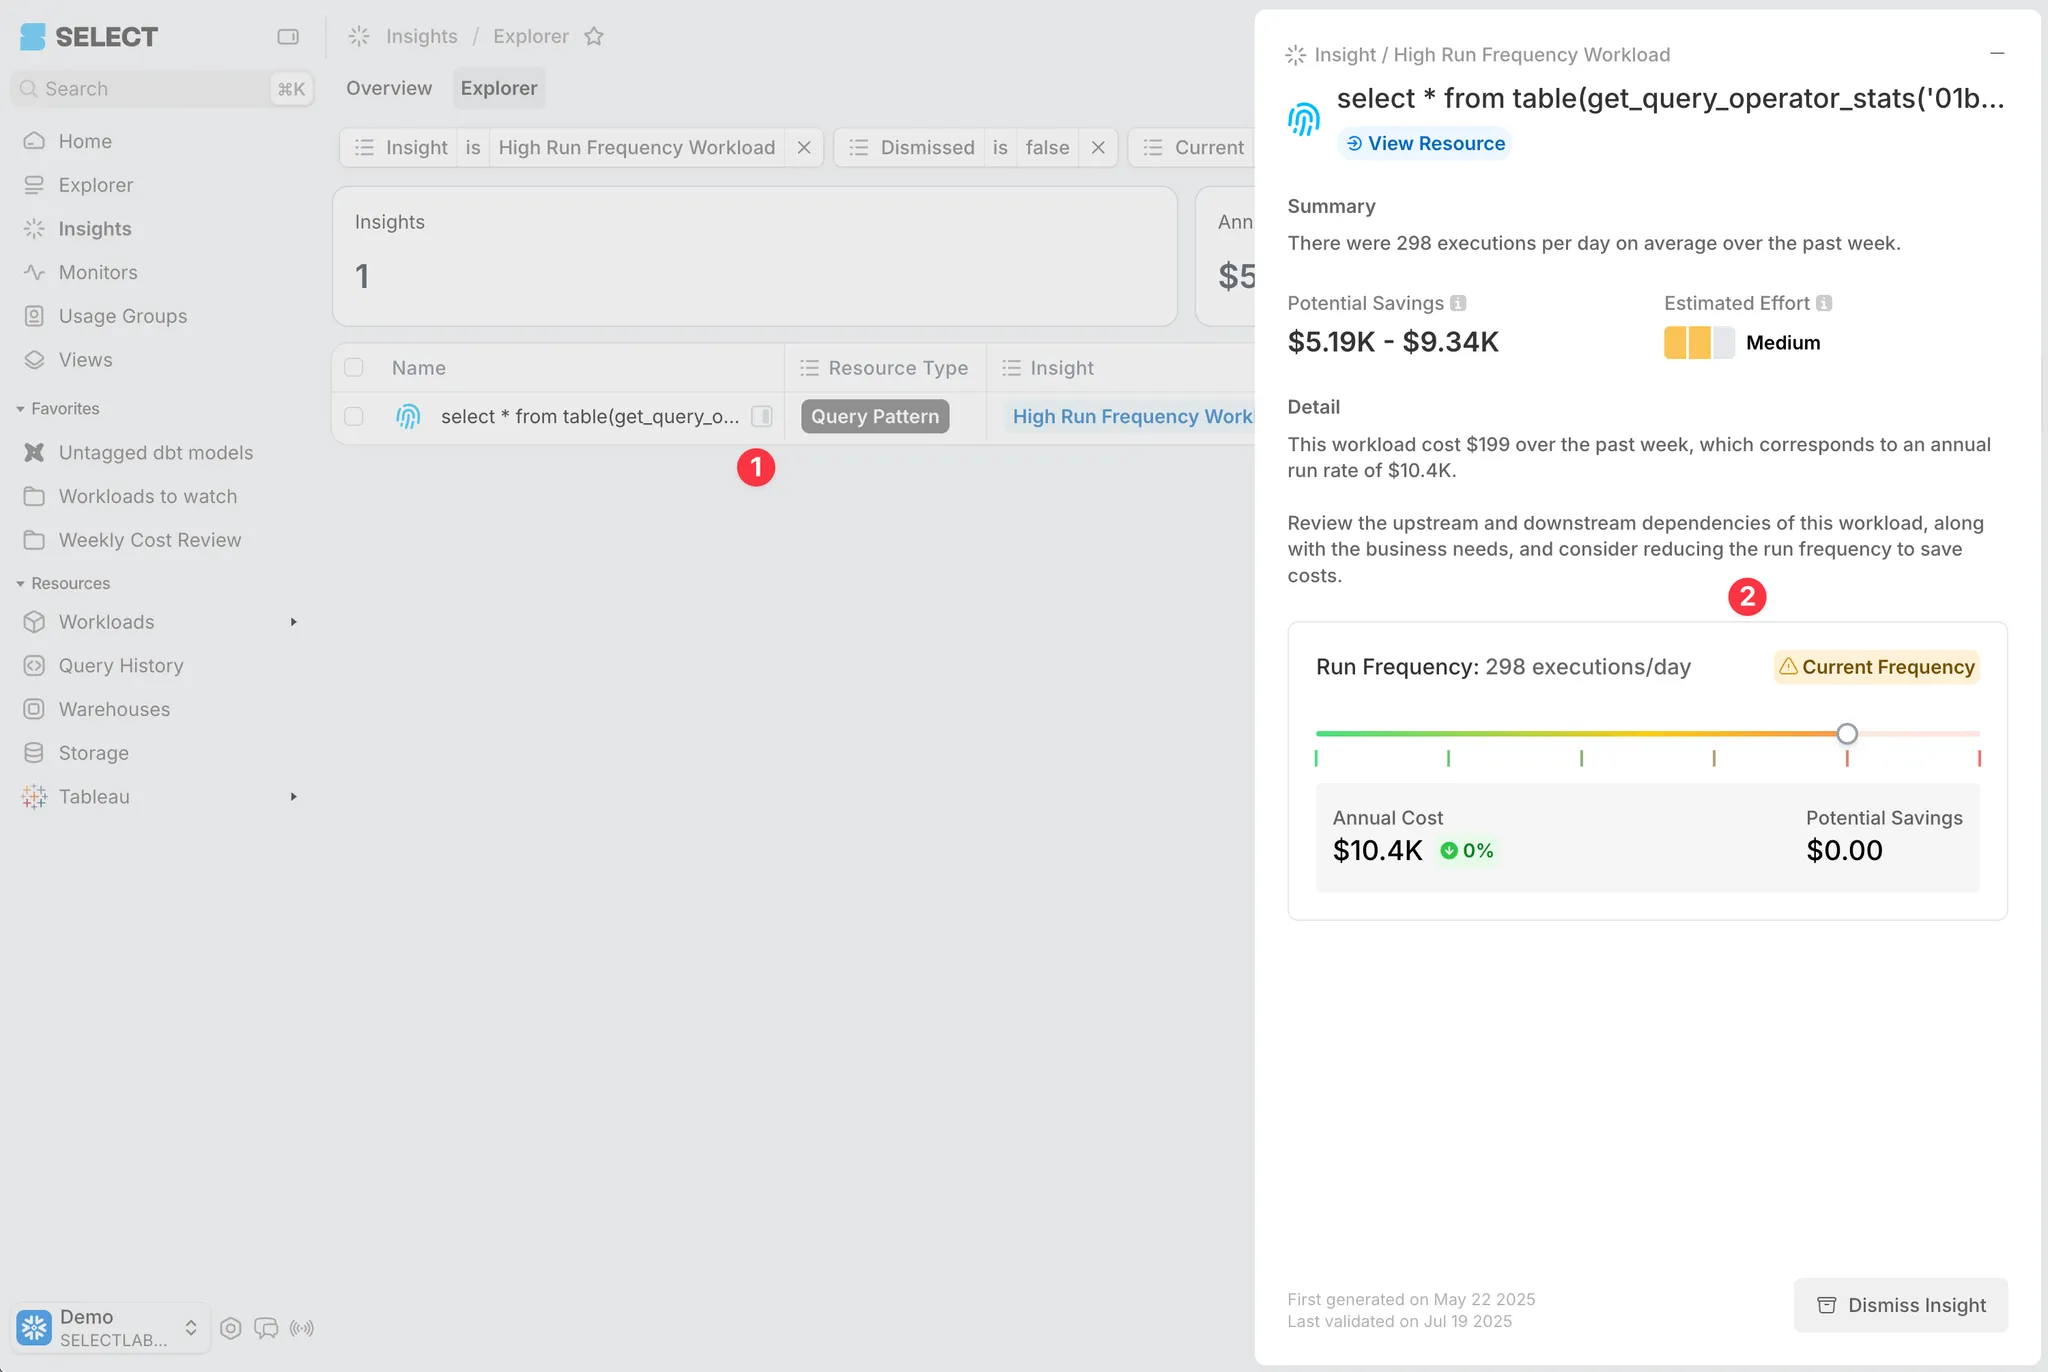
On the subsequent page you’ll find each workload that is running frequently, and in some cases you’ll get a tool-tip that compares the write frequency vs the read frequency of a table.

Let’s use the side peek button to open up the side drawer. Here we can use the slider to see the savings by reducing the run frequency of the job.
Find Low Effort Opportunities
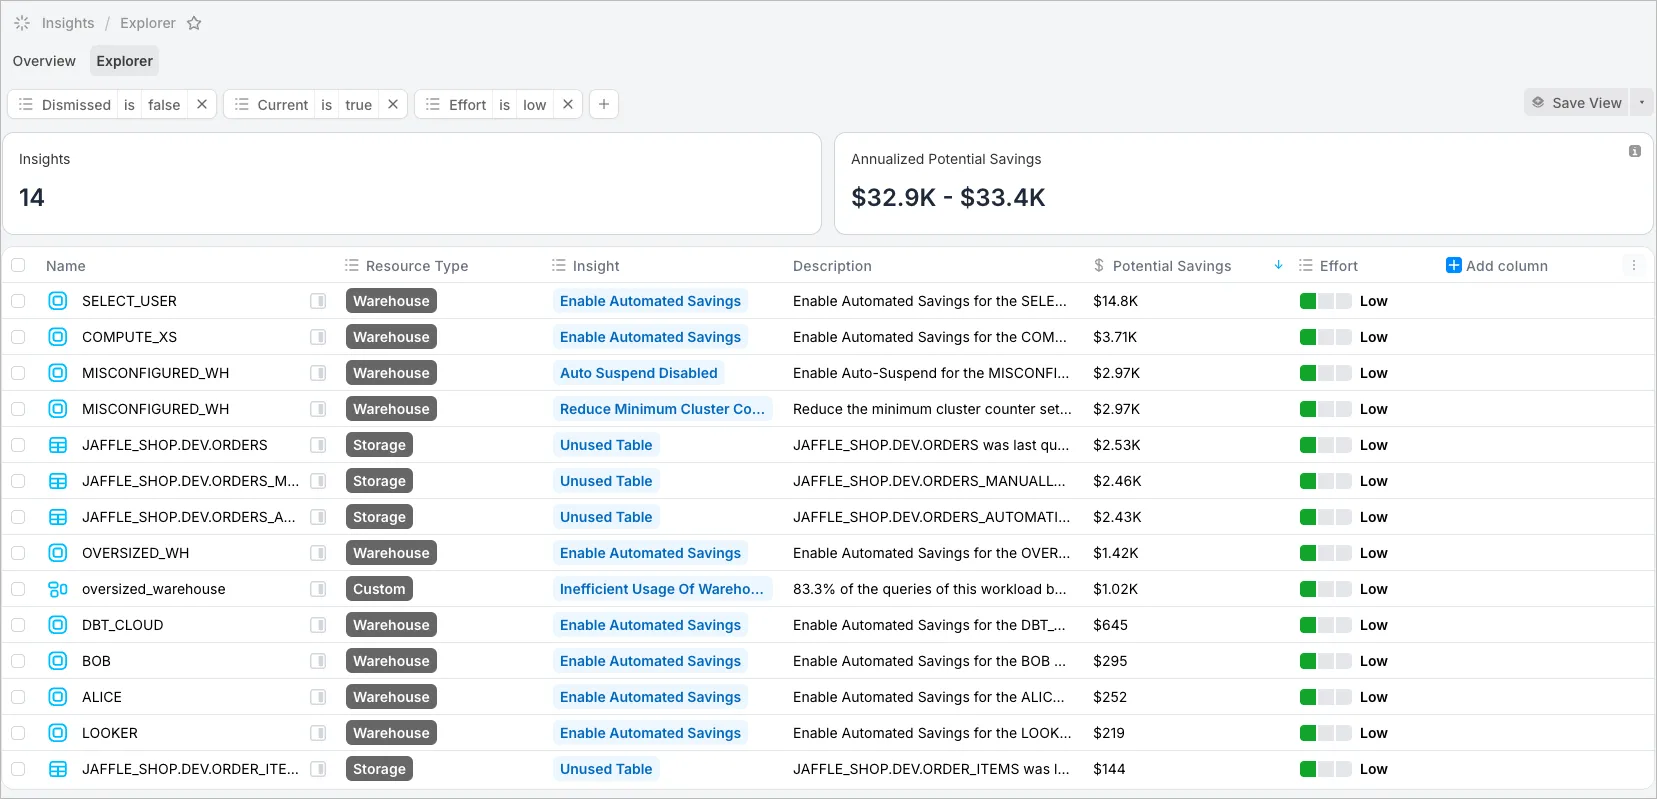
To find low effort opportunities, click the Explorer tab near the top of the Insights Page. On the Explorer page, click the “+” Filter button, then select Effort → is → Low.
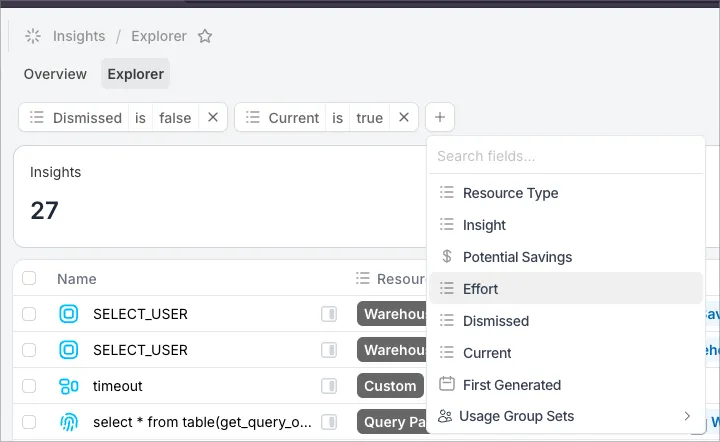
Now you have a list of all your low effort optimizations!
More on the Insight Explorer
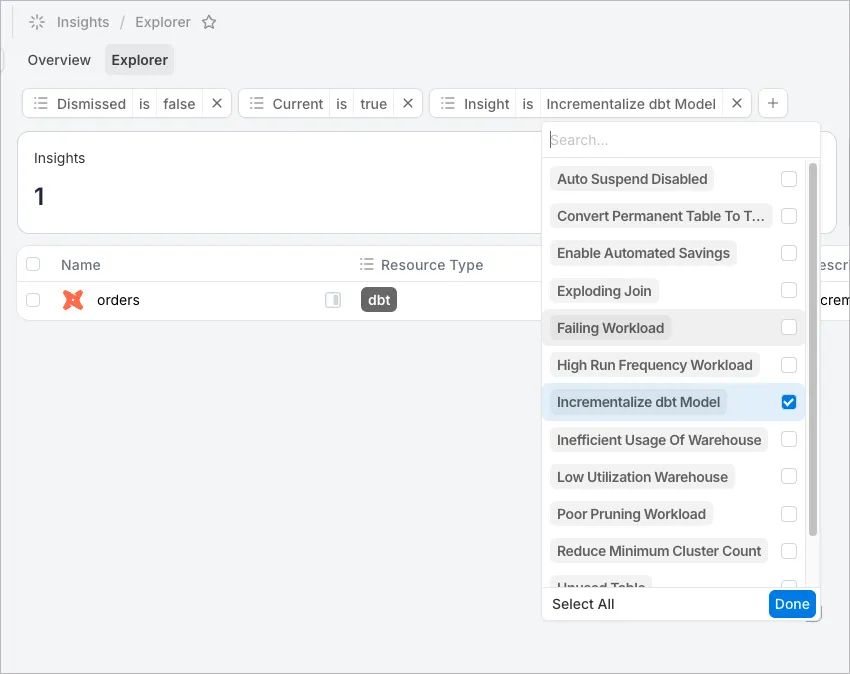
It is worth noting that we have more Insight Categories than are shown on the Insights home page. On the Explorer page, you can use “Insight is” filter to see a list of all the insight types.
When you hover on an Insight Name, you’ll get a nicely formatted tooltip explaining the Insight:

Click into a Resource to Learn More
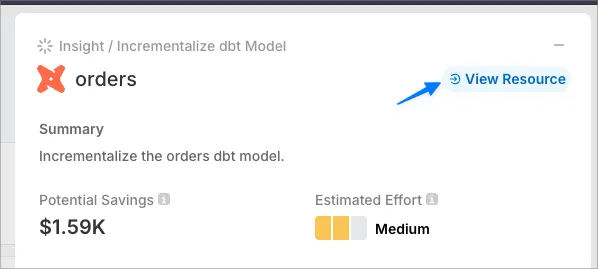
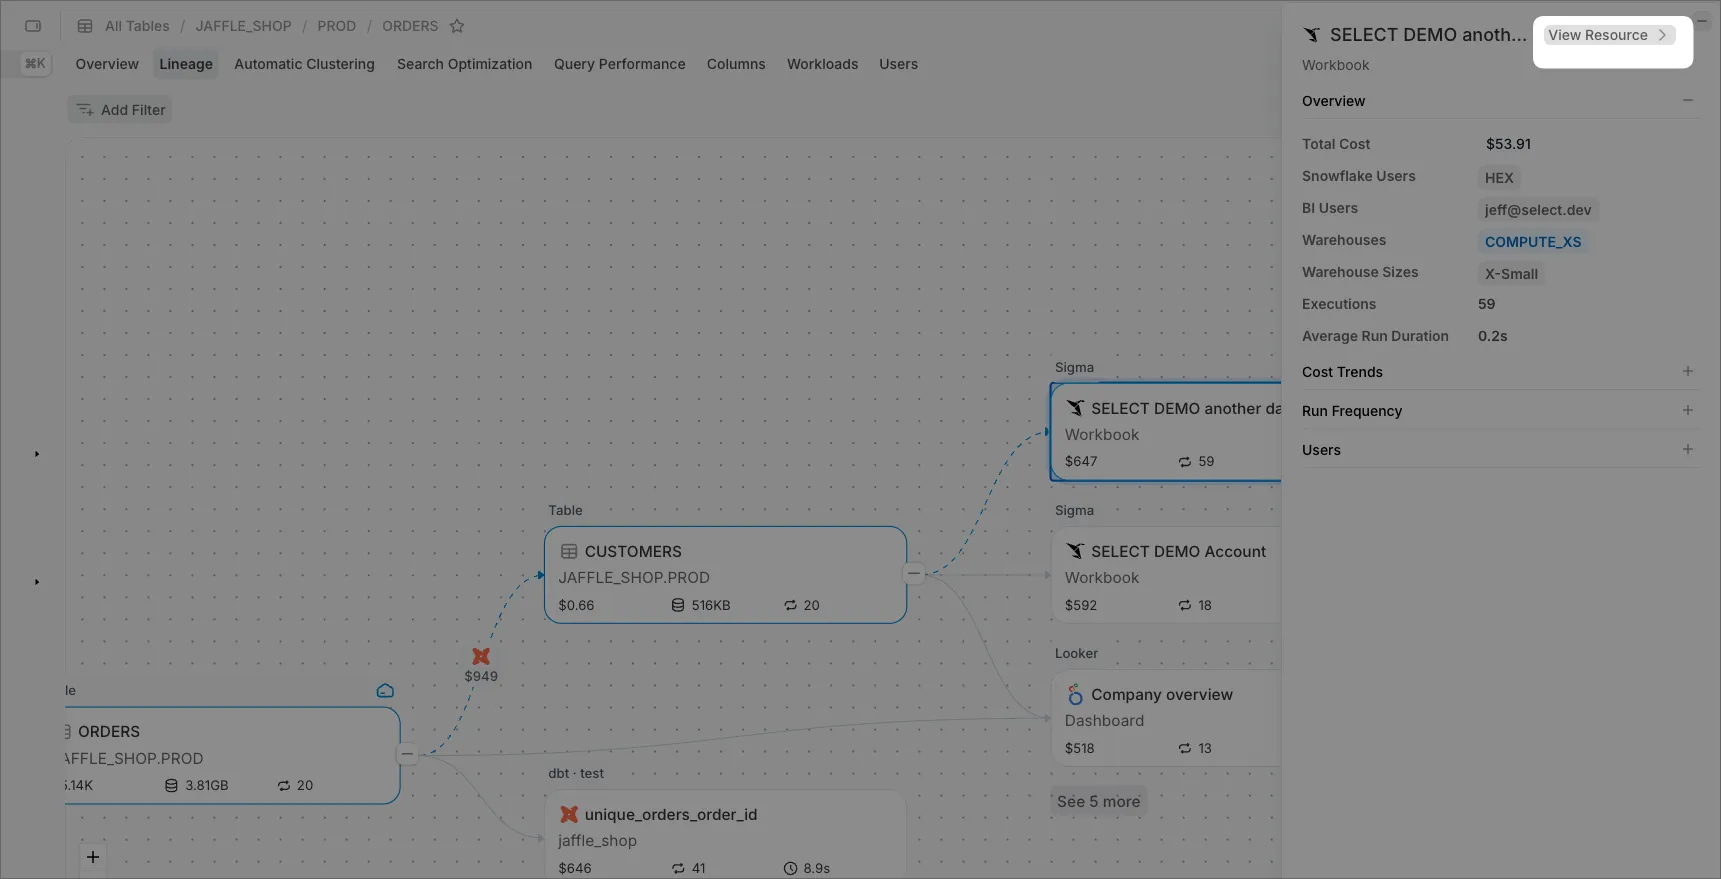
In any Insight side drawer, you can click the View Resource button to learn more.
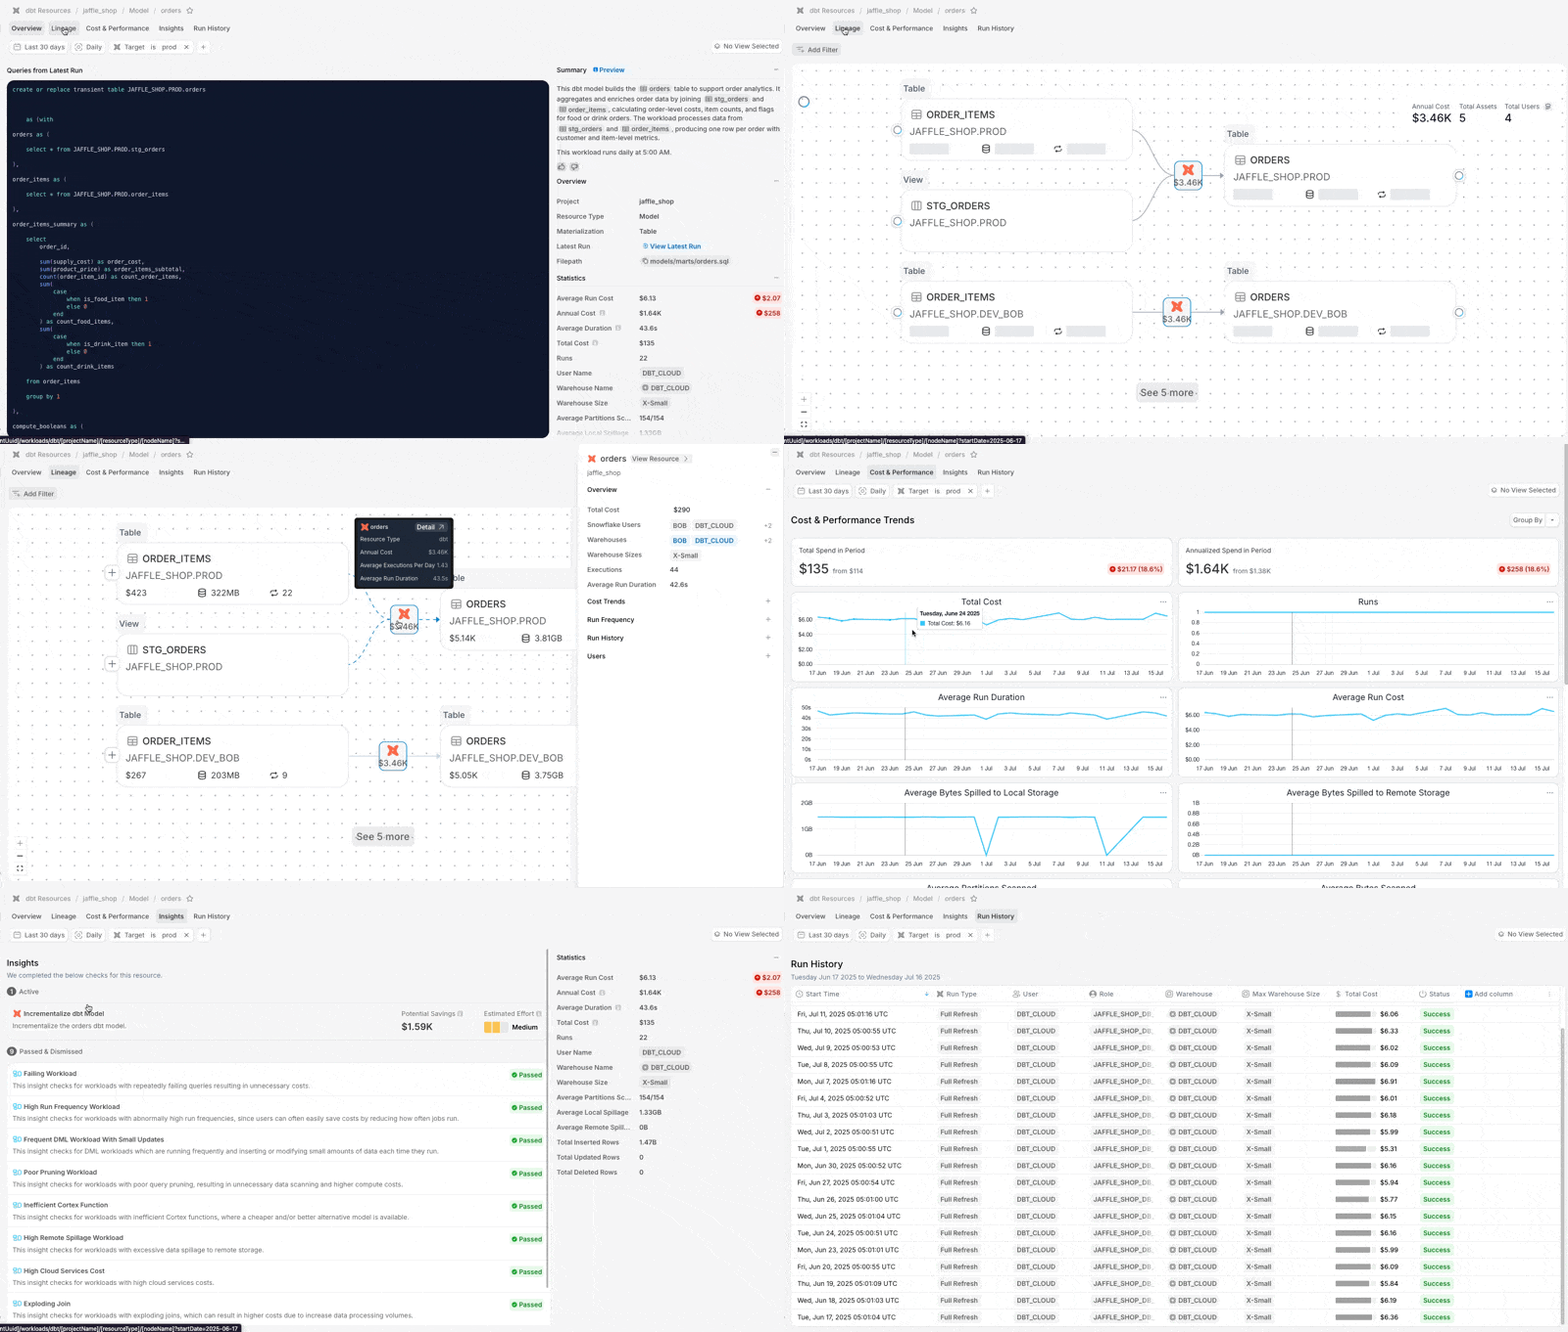
This will navigate you to the page for that specific resource. In this case it is the dbt Resources page for the Orders model. From here, I can click through all of the tabs to learn more.
Dismiss an Insight if You Want to Ignore it
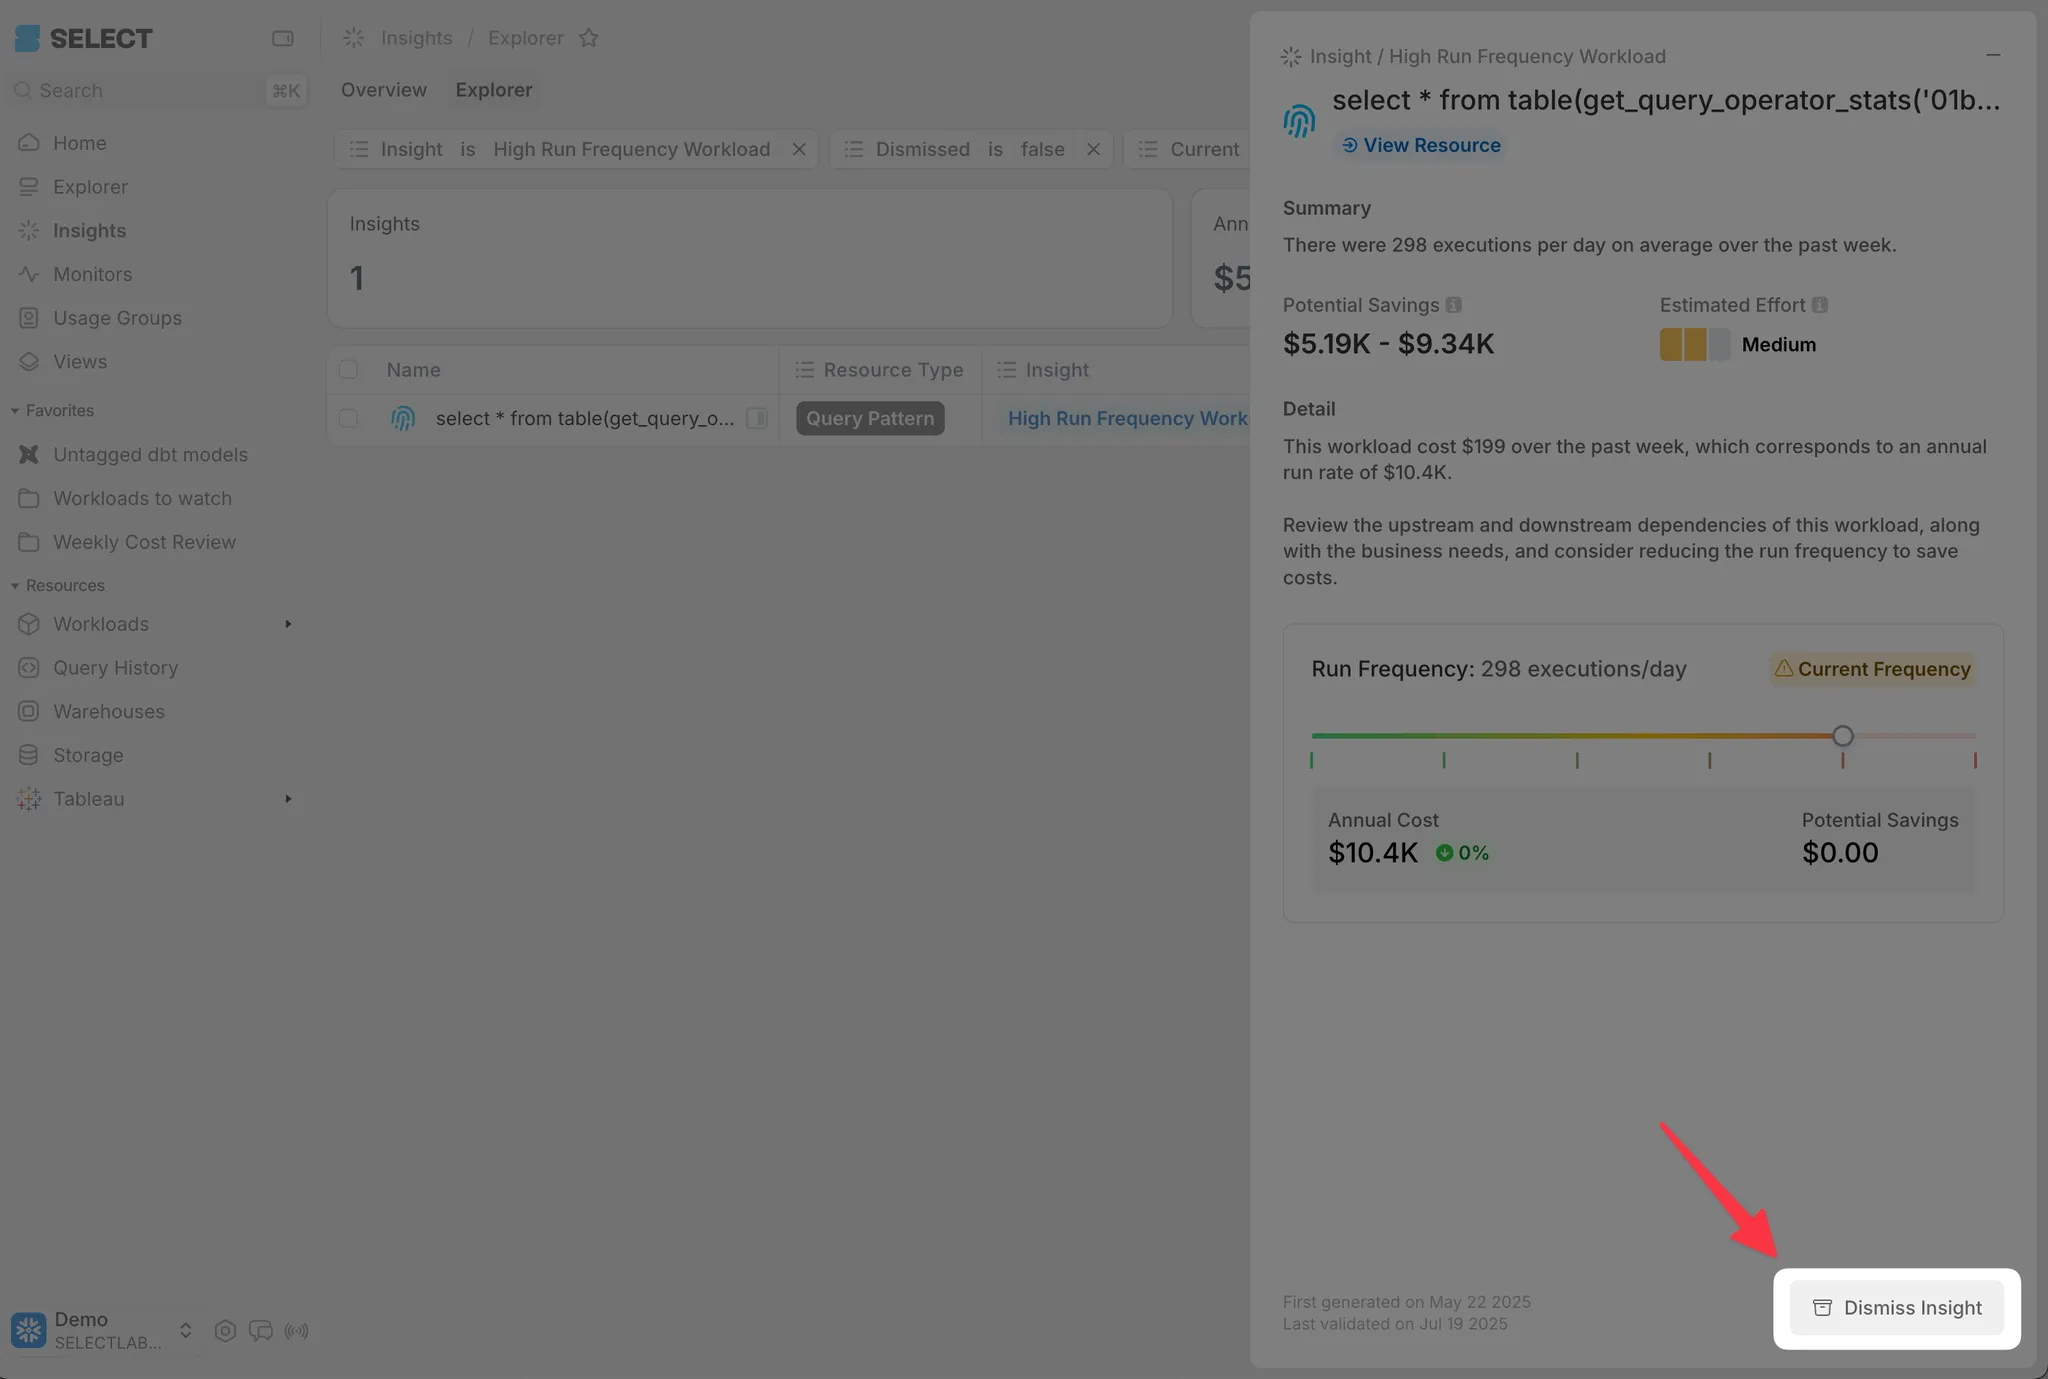
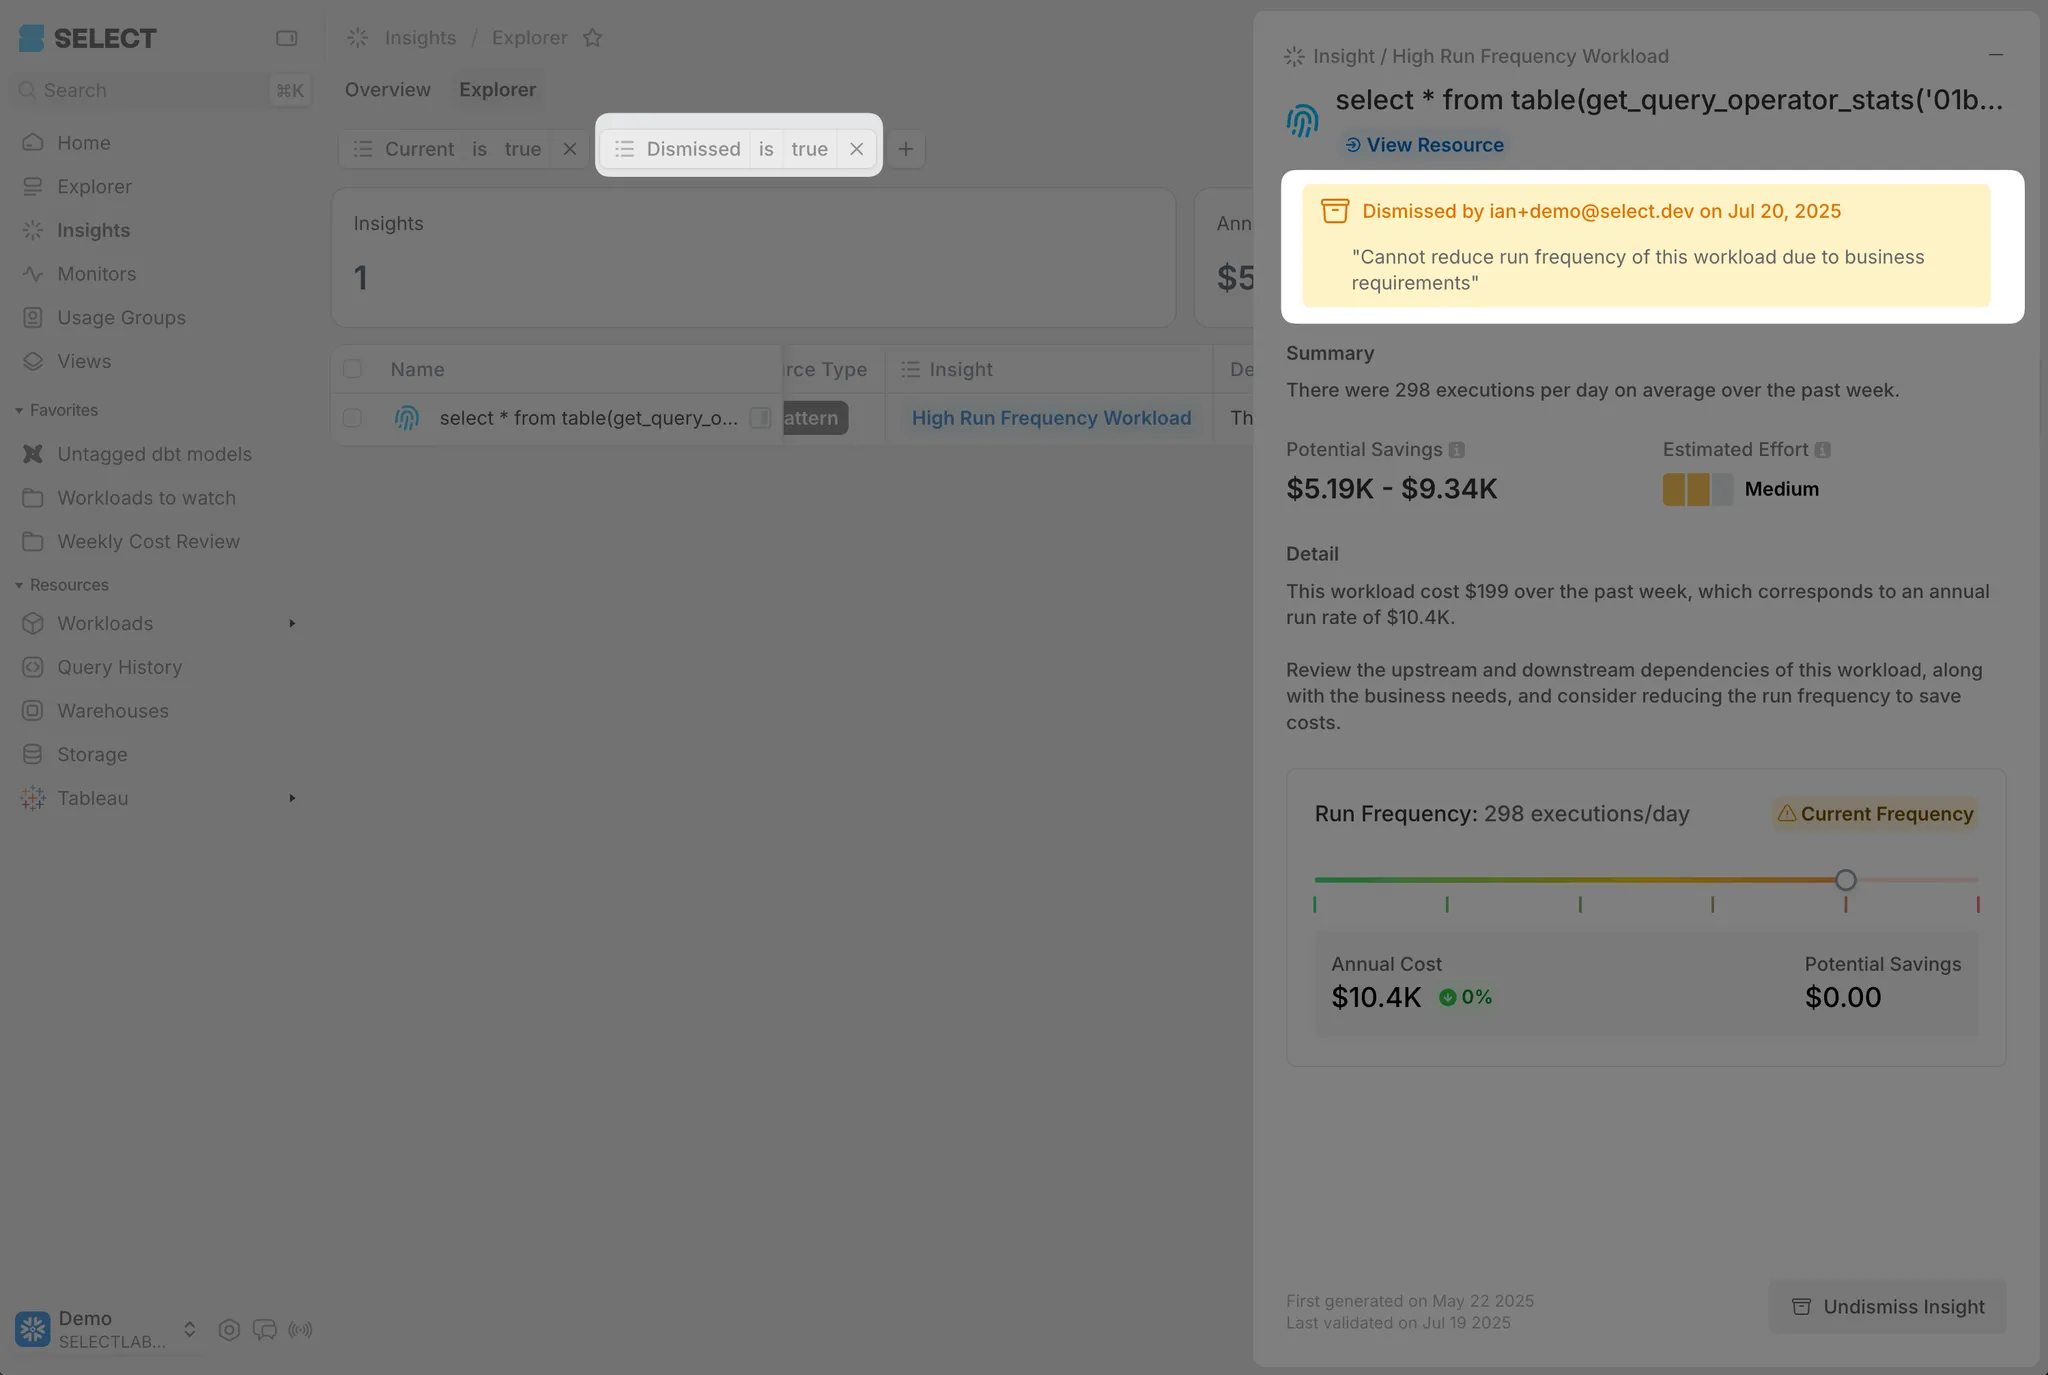
If you decide an insight isn’t applicable, click the Dismiss Insight button for the insight. You can then add a dismissal reason, i.e. “Cannot reduce run frequency of this workload due to business requirements”.
If you’d like to review your Dismissed Insights, you can do so by filtering the Explorer page to “Dismissed = true” and revisit previously dismissed Insights.
Filter the Insights Explorer by Usage Group
Don’t forget that all tables in SELECT, including Insights, are filterable by Usage Group Sets. This is an easy way to get Insights that apply to your specific team. See our guide on Usage Groups to learn more.

Method 2: Explore Top Workloads
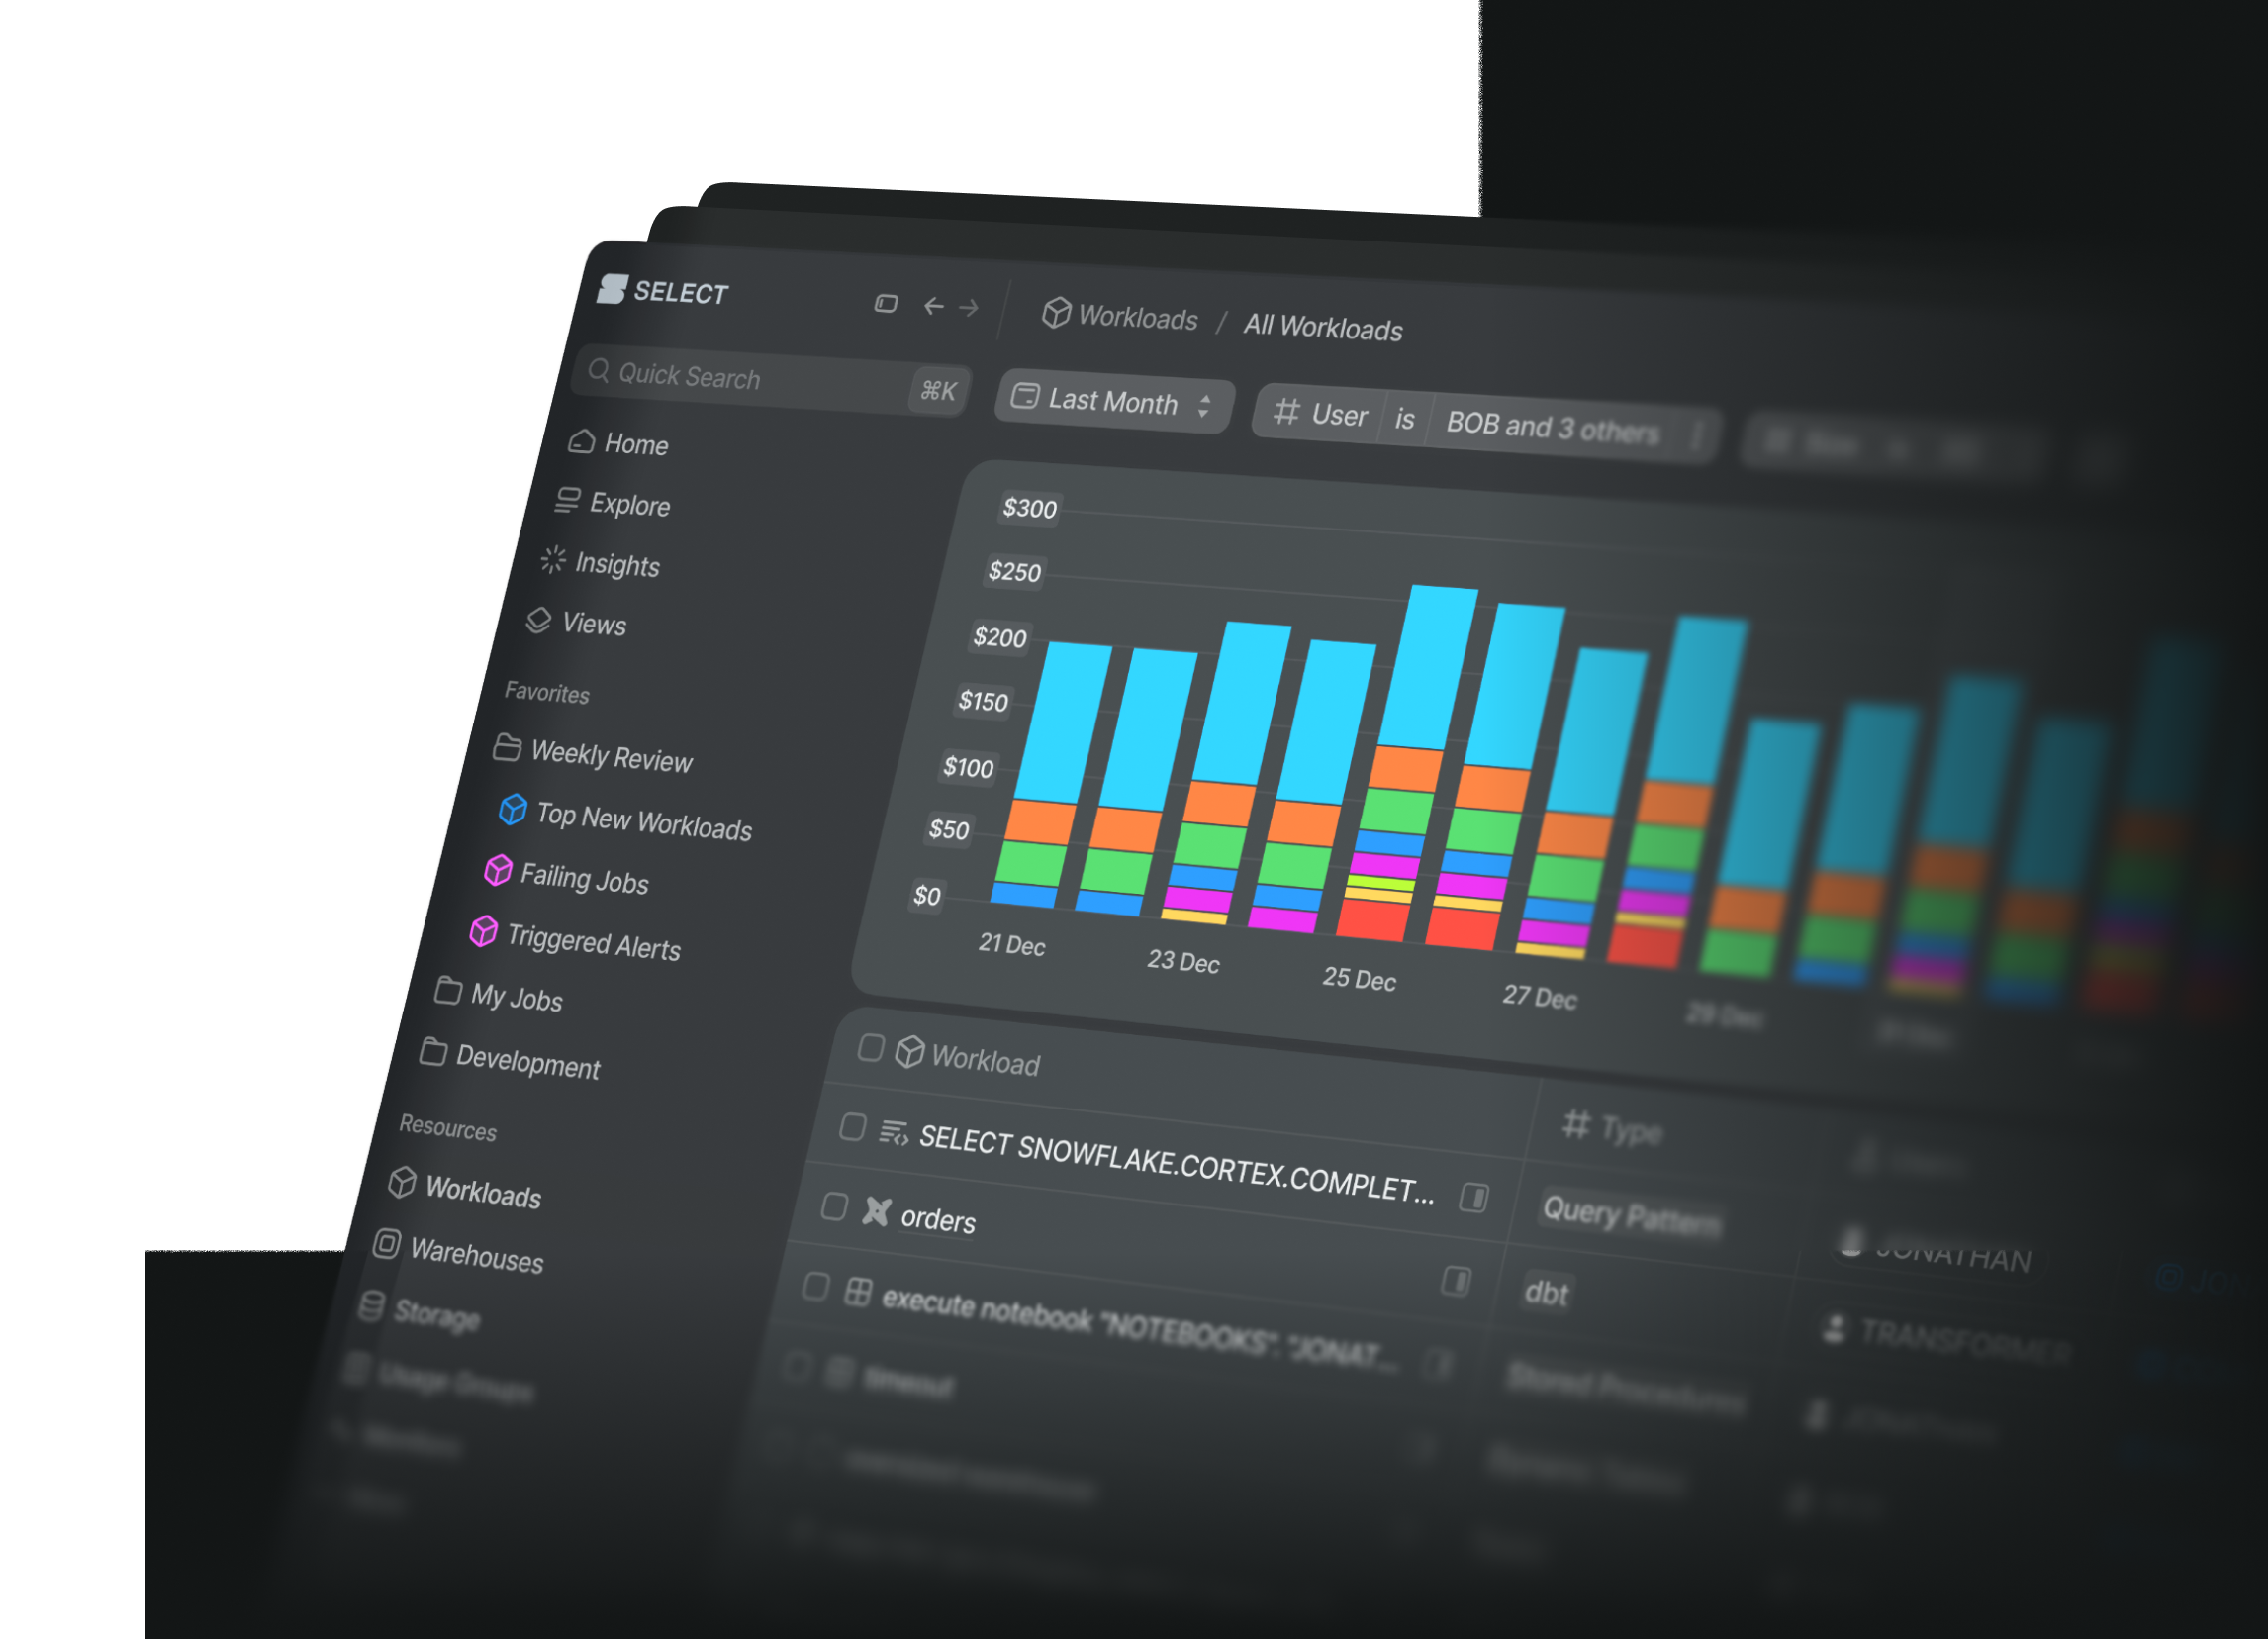
The next step is to explore the Workloads page(s), either from the All Workloads page or from a specific Workload type. The tables will automatically be sorted by your highest cost Workloads.
For each workload, ask yourself the following questions:
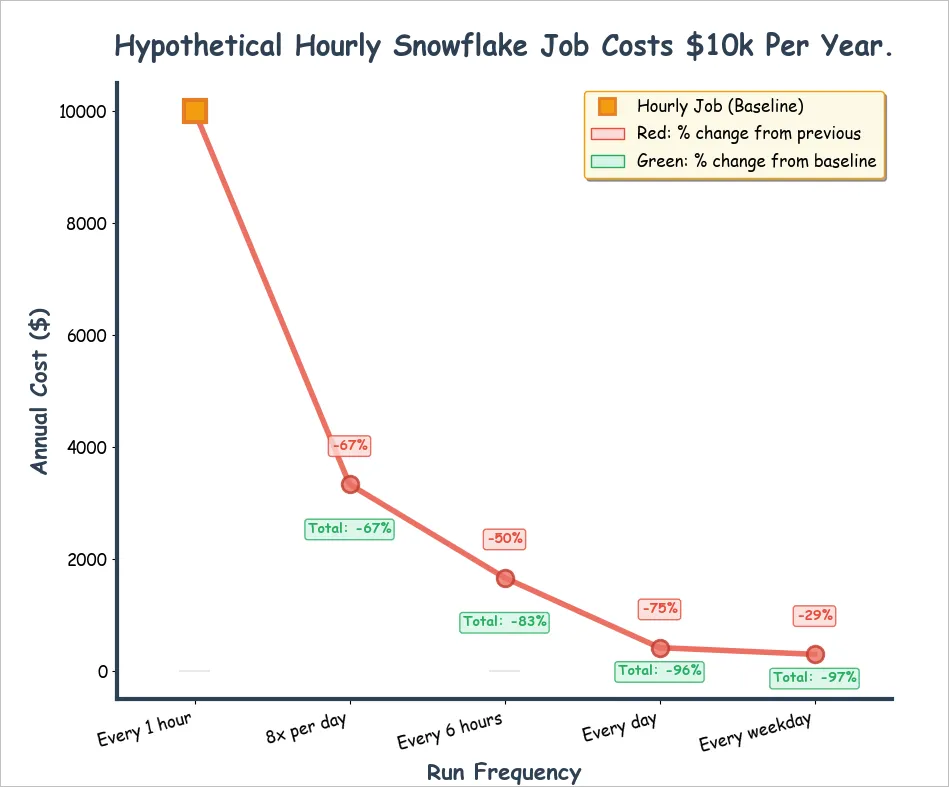
- Evaluate if you can run things less frequently. Changing an hourly job to run only during business hours saves 67%. Changing a daily job to run on weekdays only, you save 29%. Running workloads less frequently is one of the most powerful cost optimization strategies, and takes very little effort!
- Evaluate if you can run Workloads on a smaller warehouse size. If using dbt, consider using an Extra-Small as the default warehouse size and use a larger warehouse for particular workloads that require more resources. This is another powerful cost savings technique that takes less than a day to fine tune. Be sure to monitor cost and performance of any adjustments you make using the workloads page → cost and performance tab.
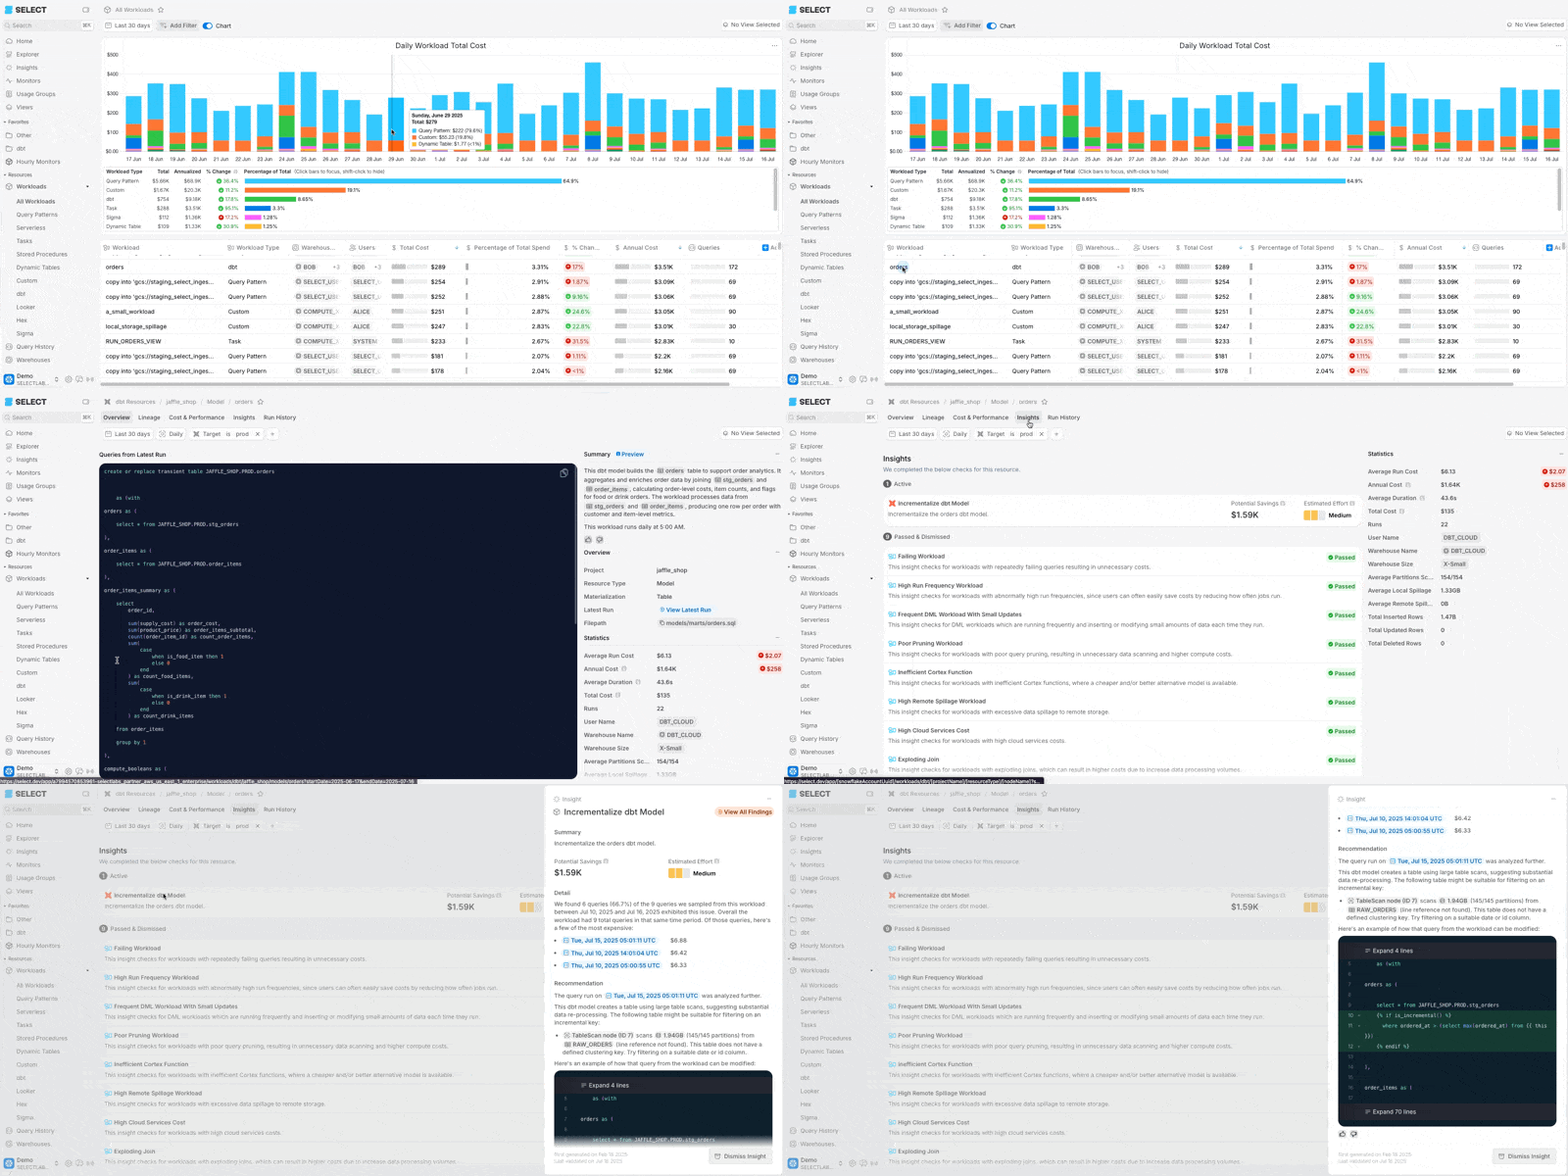
When you drill into a Workload by clicking it (click the leftmost column in the Workloads table), you can see if that workload has any specific insights.
Method 3: Use Lineage to spot additional opportunities
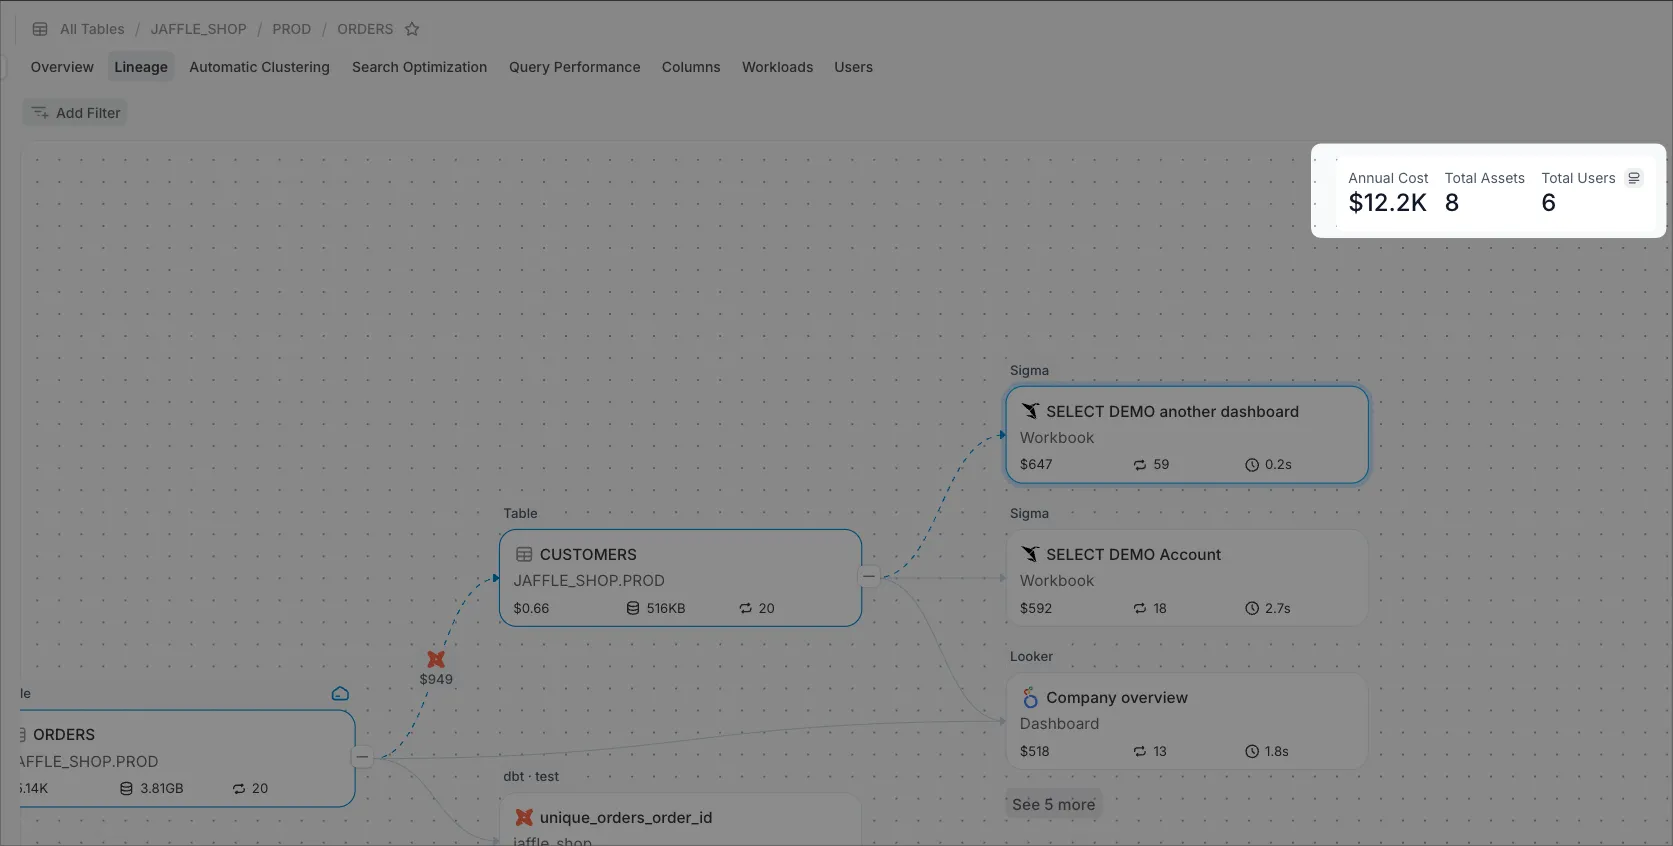
Using the Workloads → All Workloads page, we can find our most expensive workloads. Then we can drill into any interesting Workload by clicking on the Workload name. To analyze the lineage of that workload, click the Lineage tab.
In this example, I’ll analyze the lineage of my most expensive dbt asset, Orders.
You can expand the graph by clicking the + or “expand all” icons.
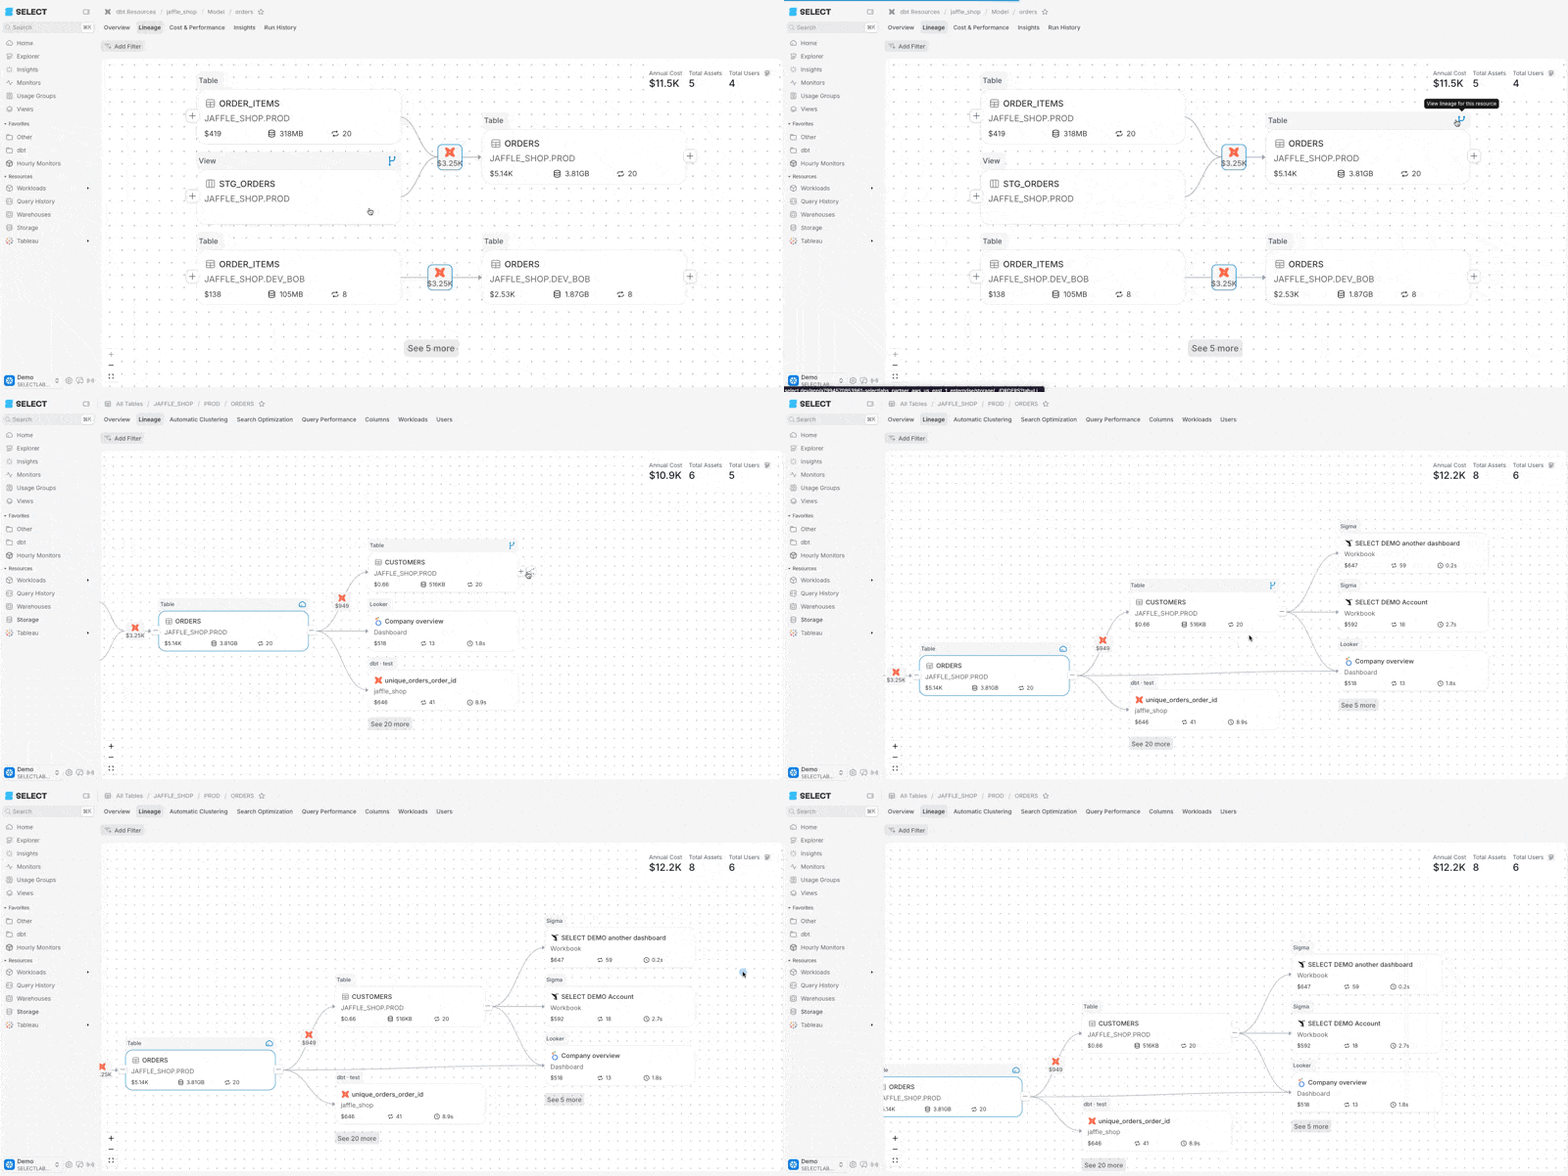
Hover on the node KPIs to get informative tool tips.
Click on a node to open the side drawer for more details on that node, or click the “View Resource” button to get more detail on that node. From here, you can see a chart of cost over time under cost trends, a run frequency chart, and a list of all users access that Snowflake resource of BI dashboard.
The KPI tile in the upper right of the Lineage page shows the total annualized cost of all of the expanded nodes in your graph. As you expand more nodes, this tile will update.
