

Micro-Partitions: Understanding Snowflake's File Structure
Niall WoodwardThursday, November 03, 2022
Independently scalable compute and storage is an architecture fundamental of Snowflake. In this post, we’ll be focusing on how Snowflake stores data, and how it can greatly accelerate query performance.
Snowflake Architecture Refresher
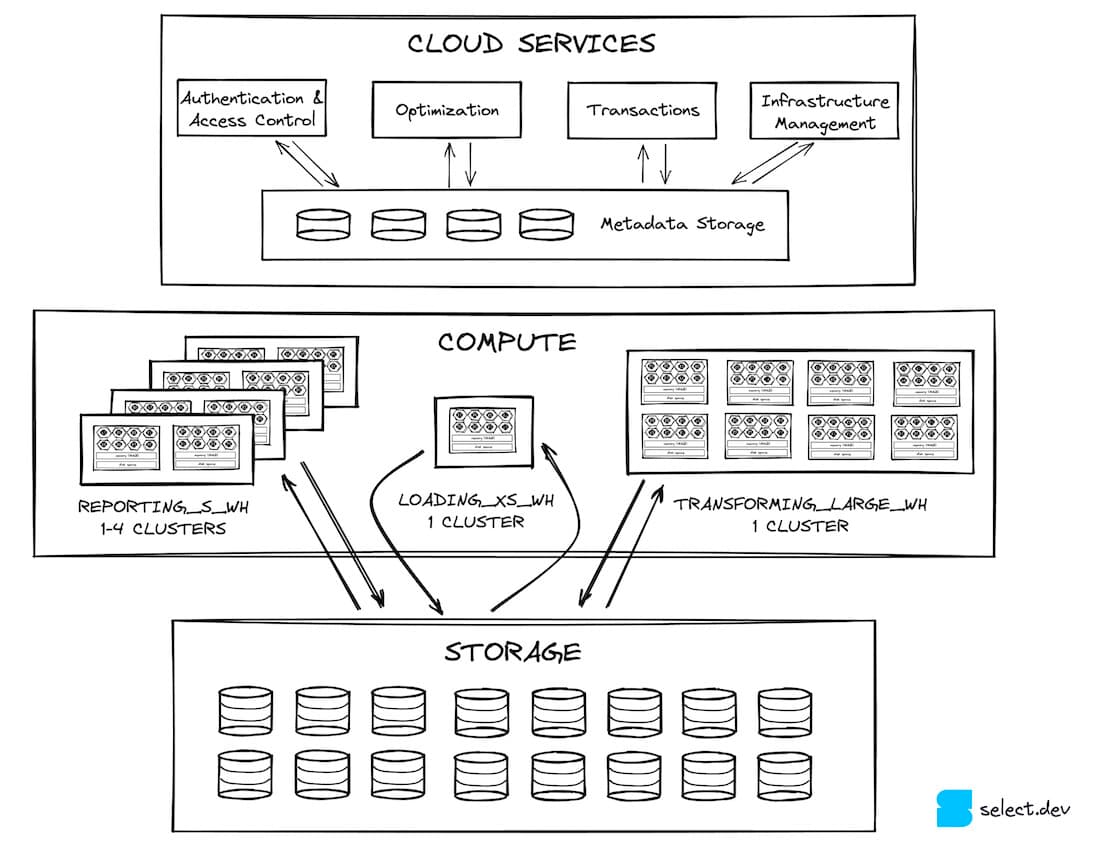
In a previous post, we discussed how Snowflake’s architecture is split into three horizontal slices. Firstly there is a cloud services layer, which is a very broad category for all Snowflake’s features outside of query execution. Cloud services interact with the massively parallel query processing layer. The virtual warehouses in the query processing layer read and write data from the storage layer, which is S3 for the majority of Snowflake customers (most Snowflake accounts run on AWS). Micro-partitions are found in this storage layer.
Micro-partitions, partitioning, clustering - what does it all mean?!
Confusingly, there are a number of similar but distinct terms associated with micro-partitions. Here’s a glossary:
- Micro-partitions (the focus of this post) - the unit of storage in Snowflake. A micro-partition put simply is a fancy kind of file. These are sometimes just referred to as partitions.
- Clustering - describes the distribution of data across micro-partitions for a particular table.
- Clustered - All tables are clustered in the sense that the data is stored in one or more micro-partitions, but the Snowflake documentation defines this as "A table with a clustering key defined is considered to be clustered."
- Well-clustered - Well-clustered describes a table that prunes well for the typical queries that are executed on it. Beware though that a table that is well-clustered is not necessarily clustered per the above definition.
- Clustering key - a clustering key or expression can be defined for a table that turns on Snowflake’s automatic clustering service. The automatic clustering service is a billable, serverless process that rearranges data in the micro-partitions to conform to the clustering key specified.
- Partitioning - partitioning doesn’t have a definition within the context of Snowflake.
- Warehouse cluster - the scaling unit in a multi-clustered warehouse.
What is a Snowflake micro-partition?
A micro-partition is a file, stored in the blob storage service for the cloud service provider on which a Snowflake account runs:
- AWS - S3
- Azure - Azure Blob Storage
- GCP - Google Cloud Storage
Micro-partitions use a proprietary, closed-source file format created by Snowflake. They contain a header enclosing metadata describing the data stored, with the actual data grouped by column and stored in a compressed format.
A single micro-partition can contain up to 16MB of compressed data (this is where the same variant constraint comes from), that uncompressed is typically between 50 and 500MB. Small tables (<500MB uncompressed) may only have a single micro-partition, and as Snowflake has no limit on table size, there is by extension no limit on the number of micro-partitions a single table can have.
A micro-partition always contains complete rows of data. This is potentially confusing, as micro-partitions are also a columnar storage format. These two attributes are not contradictory though, as individual columns are retrievable from a micro-partition. You’ll sometimes hear micro-partitions described as ‘hybrid columnar’, due to the grouping of data by both rows (a micro-partition) and columns (within each micro-partition).
Ok, enough talking, time for a diagram. Throughout the post, we will use the example of an orders table. Here's what one of the micro-partitions stored for the table looks like:
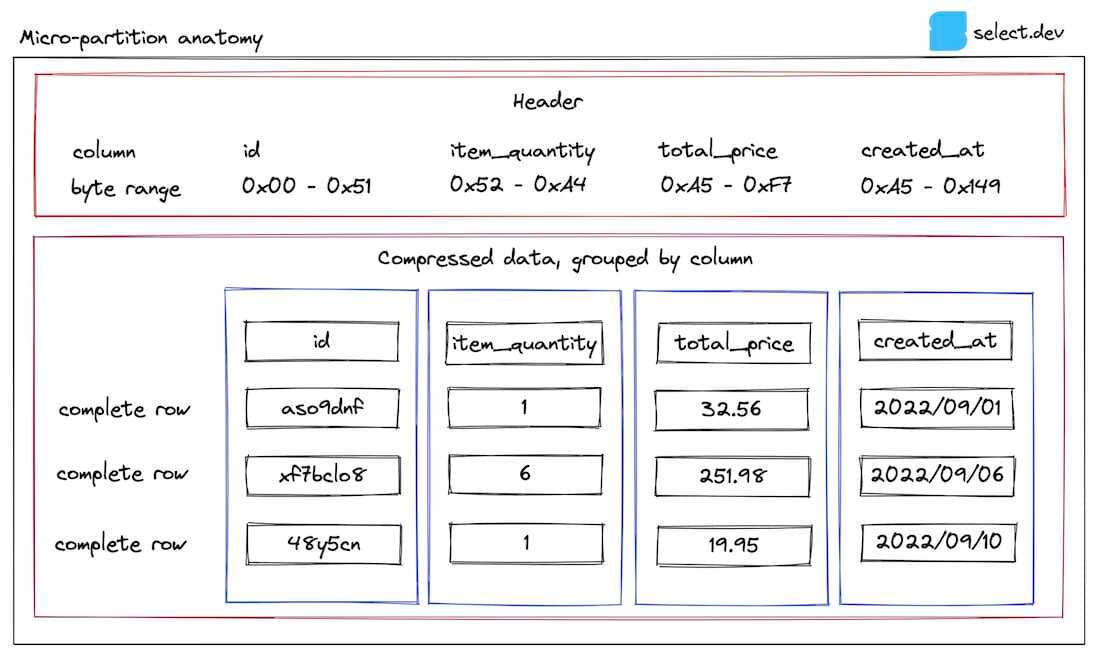
In the header, the byte ranges for each column within the micro-partition are stored, allowing Snowflake to retrieve only the columns relevant to a query using a byte range get. This is why queries will run faster if you reduce the number of columns selected.
Metadata about each column for the micro-partition is stored by Snowflake in its metadata cache in the cloud services layer. This metadata is used to provide extremely fast results for basic analytical queries such as count(*) and max(column). Additional metadata is also stored but not shown here, some of which are undocumented, described by Snowflake as 'used for both optimization and efficient query processing'.
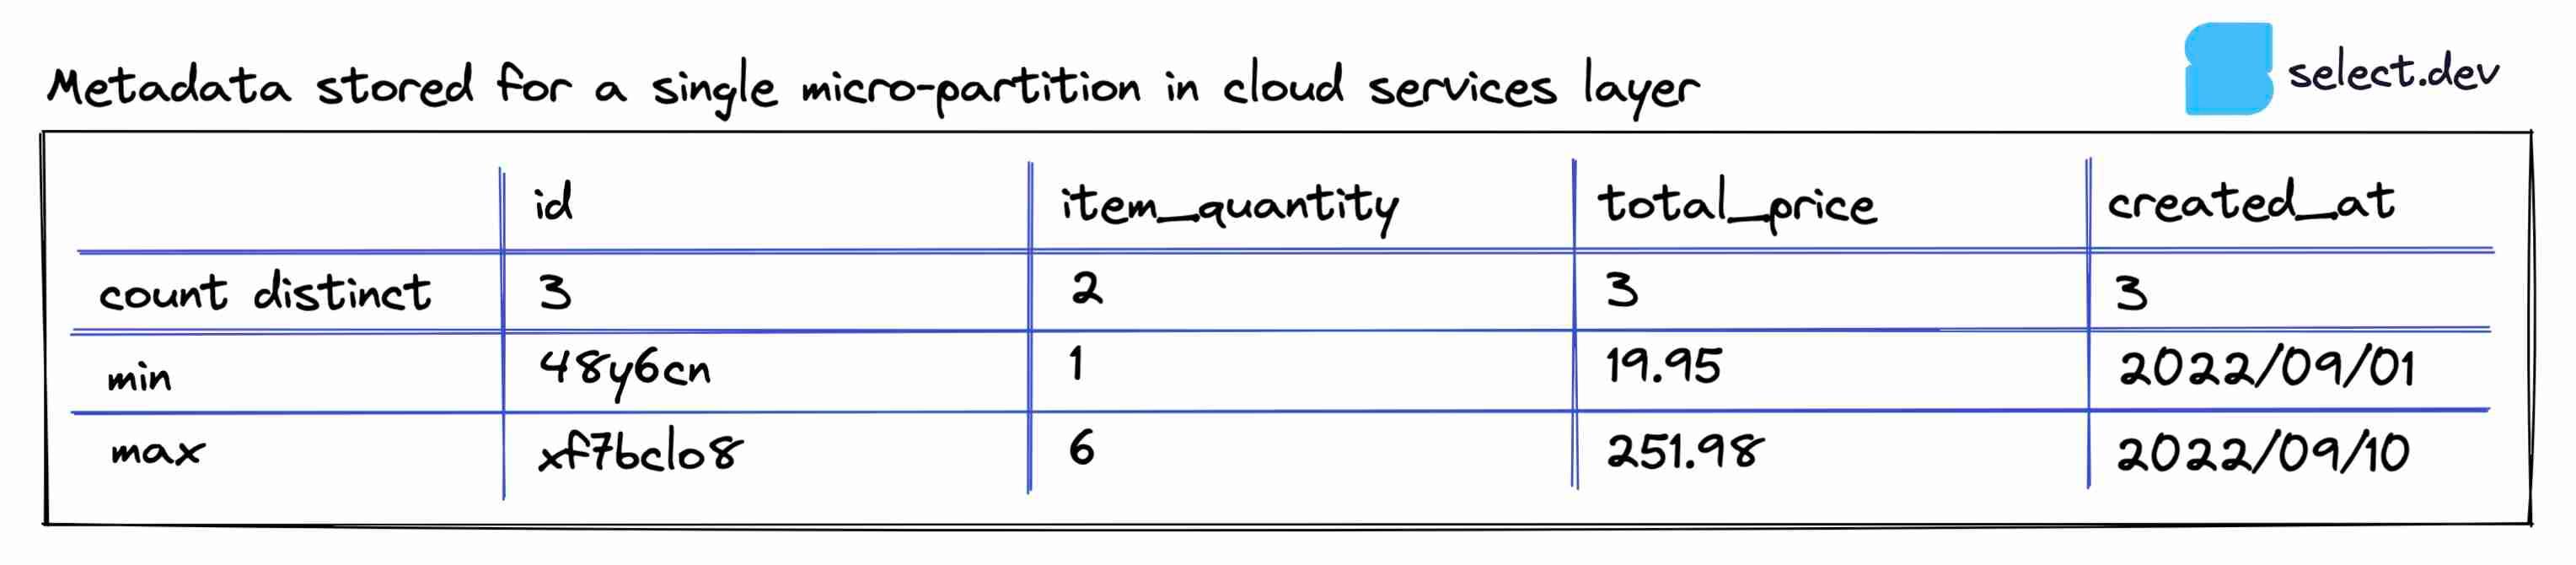
The min and max values crucially provide Snowflake with the ability to perform pruning.
What is Snowflake query pruning?
Pruning is a technique employed by Snowflake to reduce the number of micro-partitions read when executing a query. Reading micro-partitions is one of the costliest steps in a query, as it involves reading data remotely over the network. If a filter is applied in a where clause, join, or subquery, Snowflake will attempt to eliminate any micro-partitions it knows don’t contain relevant data. For this to work, the micro-partitions have to contain a narrow range of values for the column you're filtering on.
Let's zoom out to the entire orders table. In this example, the table contains 28 micro-partitions, each with three rows of data (in practice, a micro-partition typically contains hundreds of thousands of rows).
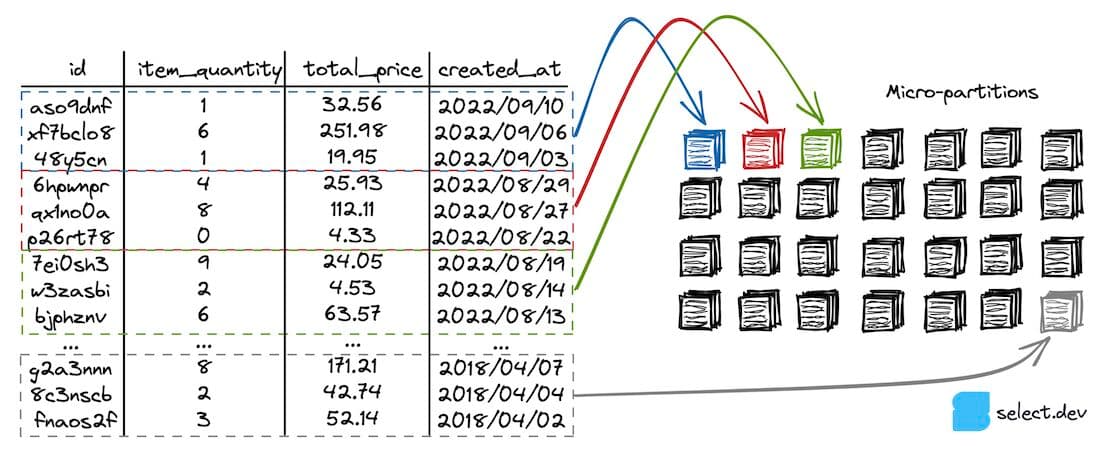
This example table is sorted and therefore well-clustered on the created_at column (each micro-partition has a narrow range of values for that column). A user runs the following query on the table:
Snowflake checks as part of the query planning process which micro-partitions contain data relevant to the query. In this case, only orders which were created after 2022/08/14 are needed. The query planner quickly identifies these records as present in only the first three micro-partitions highlighted in the diagram, using the min and max metadata for the created_at column. The rest of the micro-partitions are ignored (pruned), and Snowflake has reduced the amount of data it needs to read to only a small subset of the table.
Identifying query pruning performance
Snowflake's query profile displays lots of valuable information, including pruning performance. It's not possible to determine the pruning statistics for a query before it has been executed. Note that some queries do not require a table scan, in which case no pruning statistics will be shown.
Classic web interface
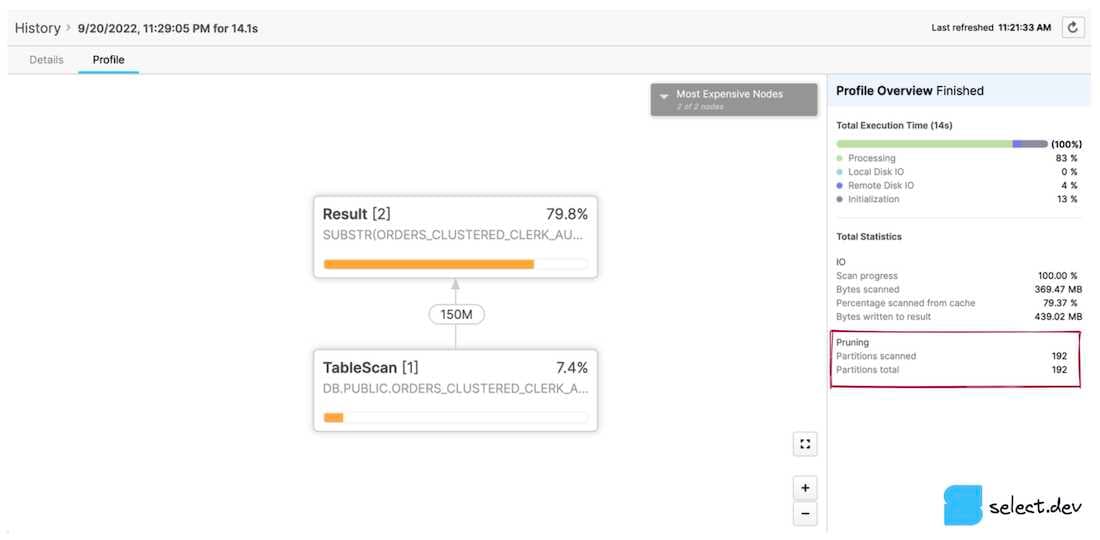
In the History or Worksheets page, click a query ID. You'll be taken to the Details page for that query. Next, click the Profile tab, and if displayed, the last step number to view all the stats for the query. On the right-hand pane, a Total Statistics section contains a Pruning subheading. Two values are displayed, partitions scanned, and partitions total.
Snowsight web interface
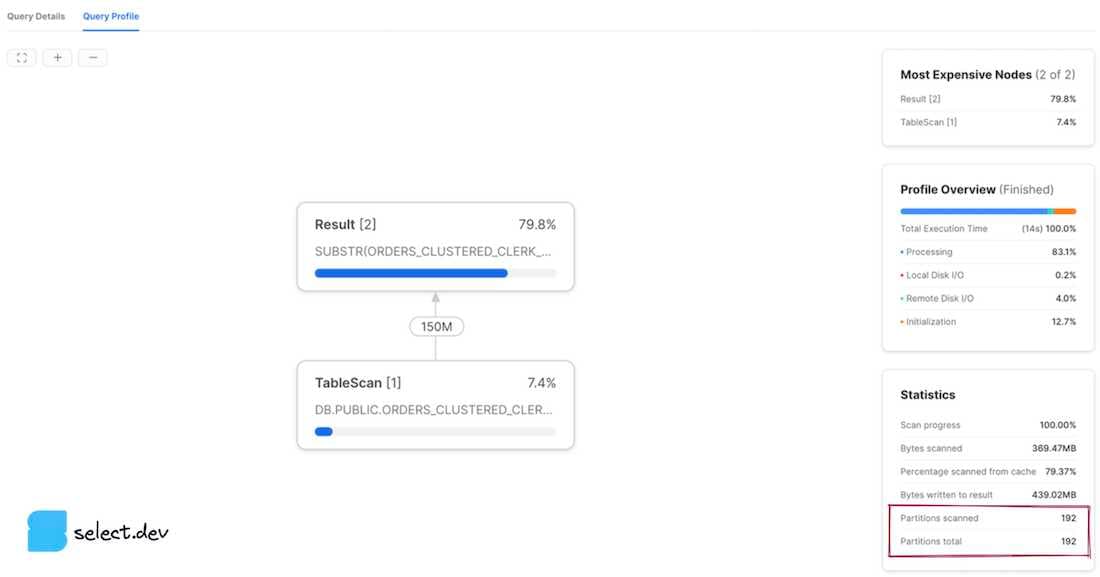
After executing a query, a Query Details pane appears to the right of the query results section. Click the three dots, and then View Query Profile. To view the profile for a query executed previously, click the Activity button in the left navigation bar, followed by Query History. Next, click the query of interest, and then the Query Profile tab. Partitions scanned and partitions total values are then displayed.
Interpreting the results
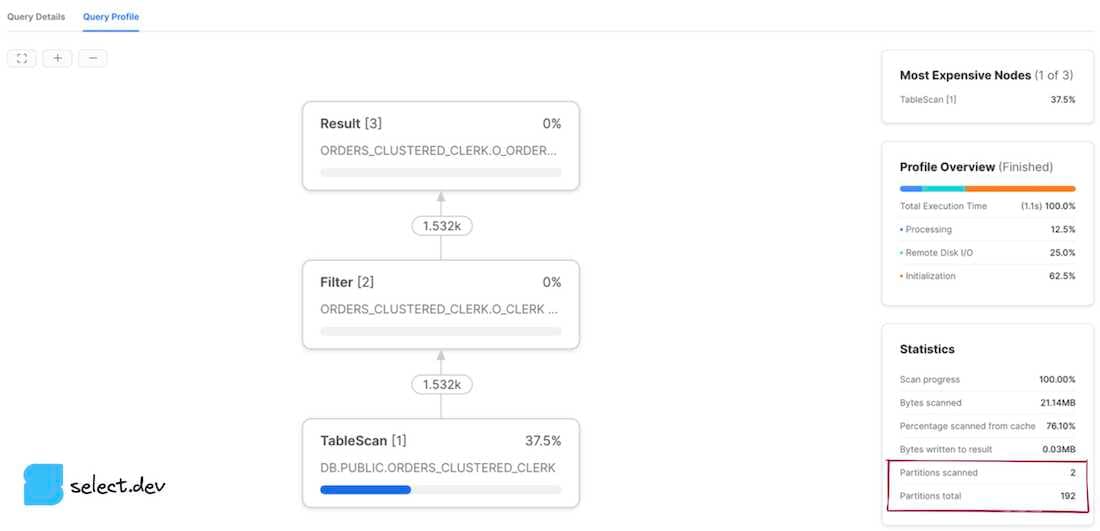
The partitions scanned value represents the number of partitions that have been read by the query. The partitions total value represents the total number of micro-partitions in existence for the tables selected from in the query. A query that demonstrates good pruning has a small number of partitions scanned in comparison to partitions total. The profiles shown above demonstrate a query with no pruning whatsoever, as the number of partitions scanned equals the total number of partitions. If we however add a filter to the query that Snowflake can use its micro-partition metadata to effectively prune on, we see significantly improved results.
In summary
We've learned what micro-partitions are, how Snowflake uses them for query optimization through pruning, and the various ways to measure pruning performance.
In our next post, we explore how you can affect a table's clustering to achieve better pruning performance.

Niall is the Co-Founder & CTO of SELECT, a SaaS Snowflake cost management and optimization platform. Prior to starting SELECT, Niall was a data engineer at Brooklyn Data Company and several startups. As an open-source enthusiast, he's also a maintainer of SQLFluff, and creator of three dbt packages: dbt_artifacts, dbt_snowflake_monitoring and dbt_query_tags.
Want to hear about our latest data cloud learnings?Subscribe to get notified.
Get up and running in less than 15 minutes
Connect your Snowflake, Databricks, or BigQuery account and instantly understand your savings potential.

