Using SELECT
Accessing Data in SELECT
Export to CSV
Users can easily export data from any chart or table they see in the SELECT UI. Just hover over the data you want to export and you'll see a menu with 4 options:
- Download to CSV
- Copy CSV to Clipboard
- Copy TSV to Clipboard (use this option to paste directly in Google Sheets!)
- View SQL (if you have a SELECT data share setup, learn more here
Data Sharing Feature Overview
Data Sharing Eligibility
Enabling data sharing for your SELECT account is an add-on feature. Please contact SELECT to determine your eligiblity and receive a quote.
Once the data share has been enabled, you can hover over any chart or table in SELECT and you will see a little code icon appear in the top left. Copy the SQL code and run it directly in your Snowflake account. You’ll see the exact data used to populate the UI in SELECT!
Setup Instructions
Using the accountadmin role, run the show shares SQL command in your account:
use role accountadmin;
show shares;
You'll see an output that looks like this:
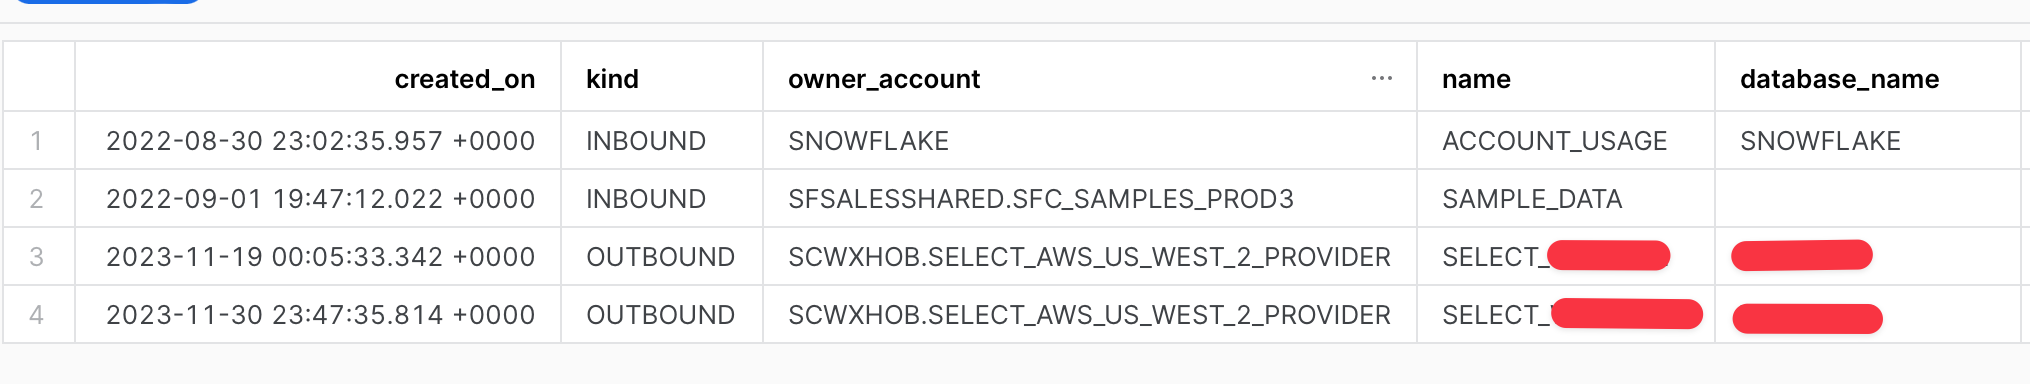
Look for the row where owner_account is something like SCWXHOB.SELECT_AWS_US_WEST_2_PROVIDER (the name will vary depending on the cloud/region you are using, but it will have the similar structure of SCWXHOB.SELECT_<cloud provider>_<cloud region>_PROVIDER). The share name will look like select_scwxhob_ad38017 i.e. select_<your account uuid>.
Copy and paste the account name and share name from the output above, then create a database in your account for the share:
-- modify using the owner_account and name from the output of the show shares query
-- keep the database named select_datashare if possible
create database select_datashare
from share scwxhob.select_aws_us_west_2_provider.select_scwxhob_ad38017
;
Avoid changing the database name
The generated SQL shown in the demo video above assumes that the database you have created is named select_datashare. You can name it something else, but the SQL code we generate will not work directly as a result.
By default, this shared database is only accessible to users with the accountadmin role. You can grant access to other users using the following command:
grant imported privileges on database select_datashare to role <enter_role_name_here>;
Querying the data with Python
If you are looking to automate spend reporting within your organization using the data available in SELECT, you can easily do so once the data share has been setup. Once you have copied & modified the relevant SQL query you want to run from the SELECT UI, you can programmatically execute that query and retrieve the results using the Snowflake Python connector.
Example Python Script
Here is an example Python script that shows the end-to-end flow for connecting to Snowflake, executing the query, and retrieving the results as a list of dictionaries:
import os

import snowflake.connector

# Replace this with your Snowflake account identifier.
# See our docs on how to find this if you don't know it.
# https://select.dev/docs/connect-snowflake-account#using-snowsight-recommended
account_identifier = 'your_account_identifier'

# Ensure this is a service user account that doesn't require MFA
user = os.environ['SNOWFLAKE_USERNAME']
password = os.environ['SNOWFLAKE_PASSWORD']

# Example SQL query. Update this!
sql = """
select
    query_id
from snowflake.account_usage.query_history
where
    start_time > current_date - 1
limit 10
"""

# Establish a connection to Snowflake
conn = snowflake.connector.connect(
    user=user,
    password=password,
    account=account_identifier,
)
# Create a cursor object
cursor = conn.cursor()

try:
    # Execute the SQL query
    cursor.execute(sql)
    # Fetch the results
    results = cursor.fetchall()
    # Get column names
    column_names = [desc[0] for desc in cursor.description]
    # Convert the results to a list of dictionaries
    result_list = [dict(zip(column_names, row)) for row in results]
finally:
    # Close the connection
    conn.close()
Here's an example of the result_list output from above:
>>> result_list
[{'QUERY_ID': '01b17a56-0000-48b5-0000-3de90684bc82'}, {'QUERY_ID': '01b17a56-0000-48b5-0000-3de90684bc86'}, {'QUERY_ID': '01b17a56-0000-48b5-0000-3de90684bc8a'}, {'QUERY_ID': '01b17a56-0000-4892-0000-3de90684c922'}, {'QUERY_ID': '01b17a56-0000-48c1-0000-3de90684e48a'}, {'QUERY_ID': '01b17a56-0000-48c1-0000-3de90684e48e'}, {'QUERY_ID': '01b17a54-0000-4892-0000-3de90684c91a'}, {'QUERY_ID': '01b17a54-0000-48c1-0000-3de90684e482'}, {'QUERY_ID': '01b17a53-0000-48b5-0000-3de90684bc7e'}, {'QUERY_ID': '01b17a53-0000-4892-0000-3de90684c916'}]
>>>
Generating a custom date range
Let's imagine you want to report on spend by Snowflake service, and you grab the corresponding query from SELECT's UI:
In the generated SQL, a date range is shown for the period selected in the web UI. For your custom reporting, you'll likely want to change this.
select
    to_char(date, 'YYYY-MM-DD') as day,
    service as service,
    sum(spend_net_cloud_services) as sum_spend_net_cloud_services
from select_datashare.transformed.daily_spend_select
where
    to_char(date, 'YYYY-MM-DD') >= '2023-11-07' -- dates from the SELECT web UI
    and to_char(date, 'YYYY-MM-DD') <= '2024-01-05'
group by all
We can accomplish this using the datetime library from Python
from datetime import datetime, timedelta

period_end = datetime.now() - timedelta(days=1)
period_start = period_end - timedelta(days=30)

sql = f"""
select
    to_char(date, 'YYYY-MM-DD') as day,
    service as service,
    sum(spend_net_cloud_services) as sum_spend_net_cloud_services
from select_datashare.transformed.daily_spend_select
where
    to_char(date, 'YYYY-MM-DD') >= '{period_start.strftime('%Y-%m-%d')}'
    and to_char(date, 'YYYY-MM-DD') <= '{period_end.strftime('%Y-%m-%d')}'
group by all
"""
Limitations
- Not all SELECT datasets have been exposed to the data share. Please reach out if you see a dataset that is not present and we will expedite the process of adding it.
- Not all UI elements have the code snippet available as shown in the demo above. If you see a chart/table and would like to access to underlying data but cannot see the corresponding query, please reach out to us.