

Monitoring dbt model spend and performance with metadata
Ian WhitestoneFriday, February 24, 2023
In a previous post, we covered how Snowflake query tags & comments allow users to associate arbitrary metadata with each query. In this post, we show how you can add query tags or comments to your dbt models in order to track their spend or performance over time.
Why track dbt model spend & performance?
dbt has skyrocketed in popularity over the last 5 years, becoming the most popular framework for building and managing data models within the data warehouse. Performing lots of data transformations on large datasets within the warehouse is not cheap, however. Whether using dbt, or any other SQL-based transformation tool, the costs associated with these transformations tend to make up a significant portion of Snowflake customer's compute spend.
As customers look to better understand, monitor, and reduce their data cloud spend, it has become increasingly important to get more insight into the spend associated with each dbt model. Additionally, as customers increasingly use dbt to power business critical applications and decision making, it becomes necessary for customers to monitor model performance in order to ensure that SLAs are met.
When using Snowflake and dbt, customers do not get these crucial monitoring features out of the box. By adding metadata to their dbt models through query tags or comments, customers can achieve these core monitoring abilities.
Setting query tags in dbt
In our post on query tags, we outlined the three options for setting query tags in dbt:
- Setting it globally in your
profiles.yml - Adding a
query_tagfor each model in yourdbt_project.ymlor in the model config - Creating a
set_query_tagmacro to dynamically set the query tag for each model in your project.
Approach #3 is by far the best option as it avoids having users manually set the tags. If you'd like to get started with dynamically setting query tags for each model, you can implement a custom macro like the one here to add detailed metadata to each query issued by dbt.
Setting query comments in dbt (recommended approach)
For dbt related metadata, we recommend using query comments instead of query tags since the computer generated metadata can occasionally exceed the 2000 character limit of query tags.
dbt provides this setting out of the box. In your dbt_project.yml, you can add the following:
This will add a query comment to the bottom of your query:
In order to add more comprehensive metadata in the query comment, you can install our dbt-snowflake-monitoring query package. This package makes the following metadata available for all dbt queries:
Using this info, you can can monitor cost and performance by a variety of interesting dimensions, such as dbt project, model name, environment (dev or prod), materialization type, and more.
Monitoring dbt model performance
When using query tags, you can monitor your dbt model performance using a variation of the query below:
If you're using query comments, you'll first have to parse out the metadata from the comment text:
If you're using our dbt-snowflake-monitoring package, this query comment parsing is automatically done for you.
Both queries above only look at the query run times. A number of other metrics you can monitor in conjunction are:
partitions_scanned&partitions_total: informs you whether the queries are efficiently pruning out micro-partitionsbytes_scanned: gives you an idea of how much data is being processed over time, which may explain increased run timesbytes_spilled_to_local_storage&bytes_spilled_to_remote_storage: indicates whether your model may benefit from running on a larger warehousequeued_overload_time: indiciates whether you may need to increase youmax_cluster_counton the warehouse
Monitoring dbt model spend
In order to monitor dbt model costs over time, first calculate the cost of each Snowflake query. Next, the query costs can be used to aggregate spend by model:
If you'd like to automatically get a query history with the costs for each query added, you can install our dbt-snowflake-monitoring package.
Use SELECT for dbt model cost & performance monitoring
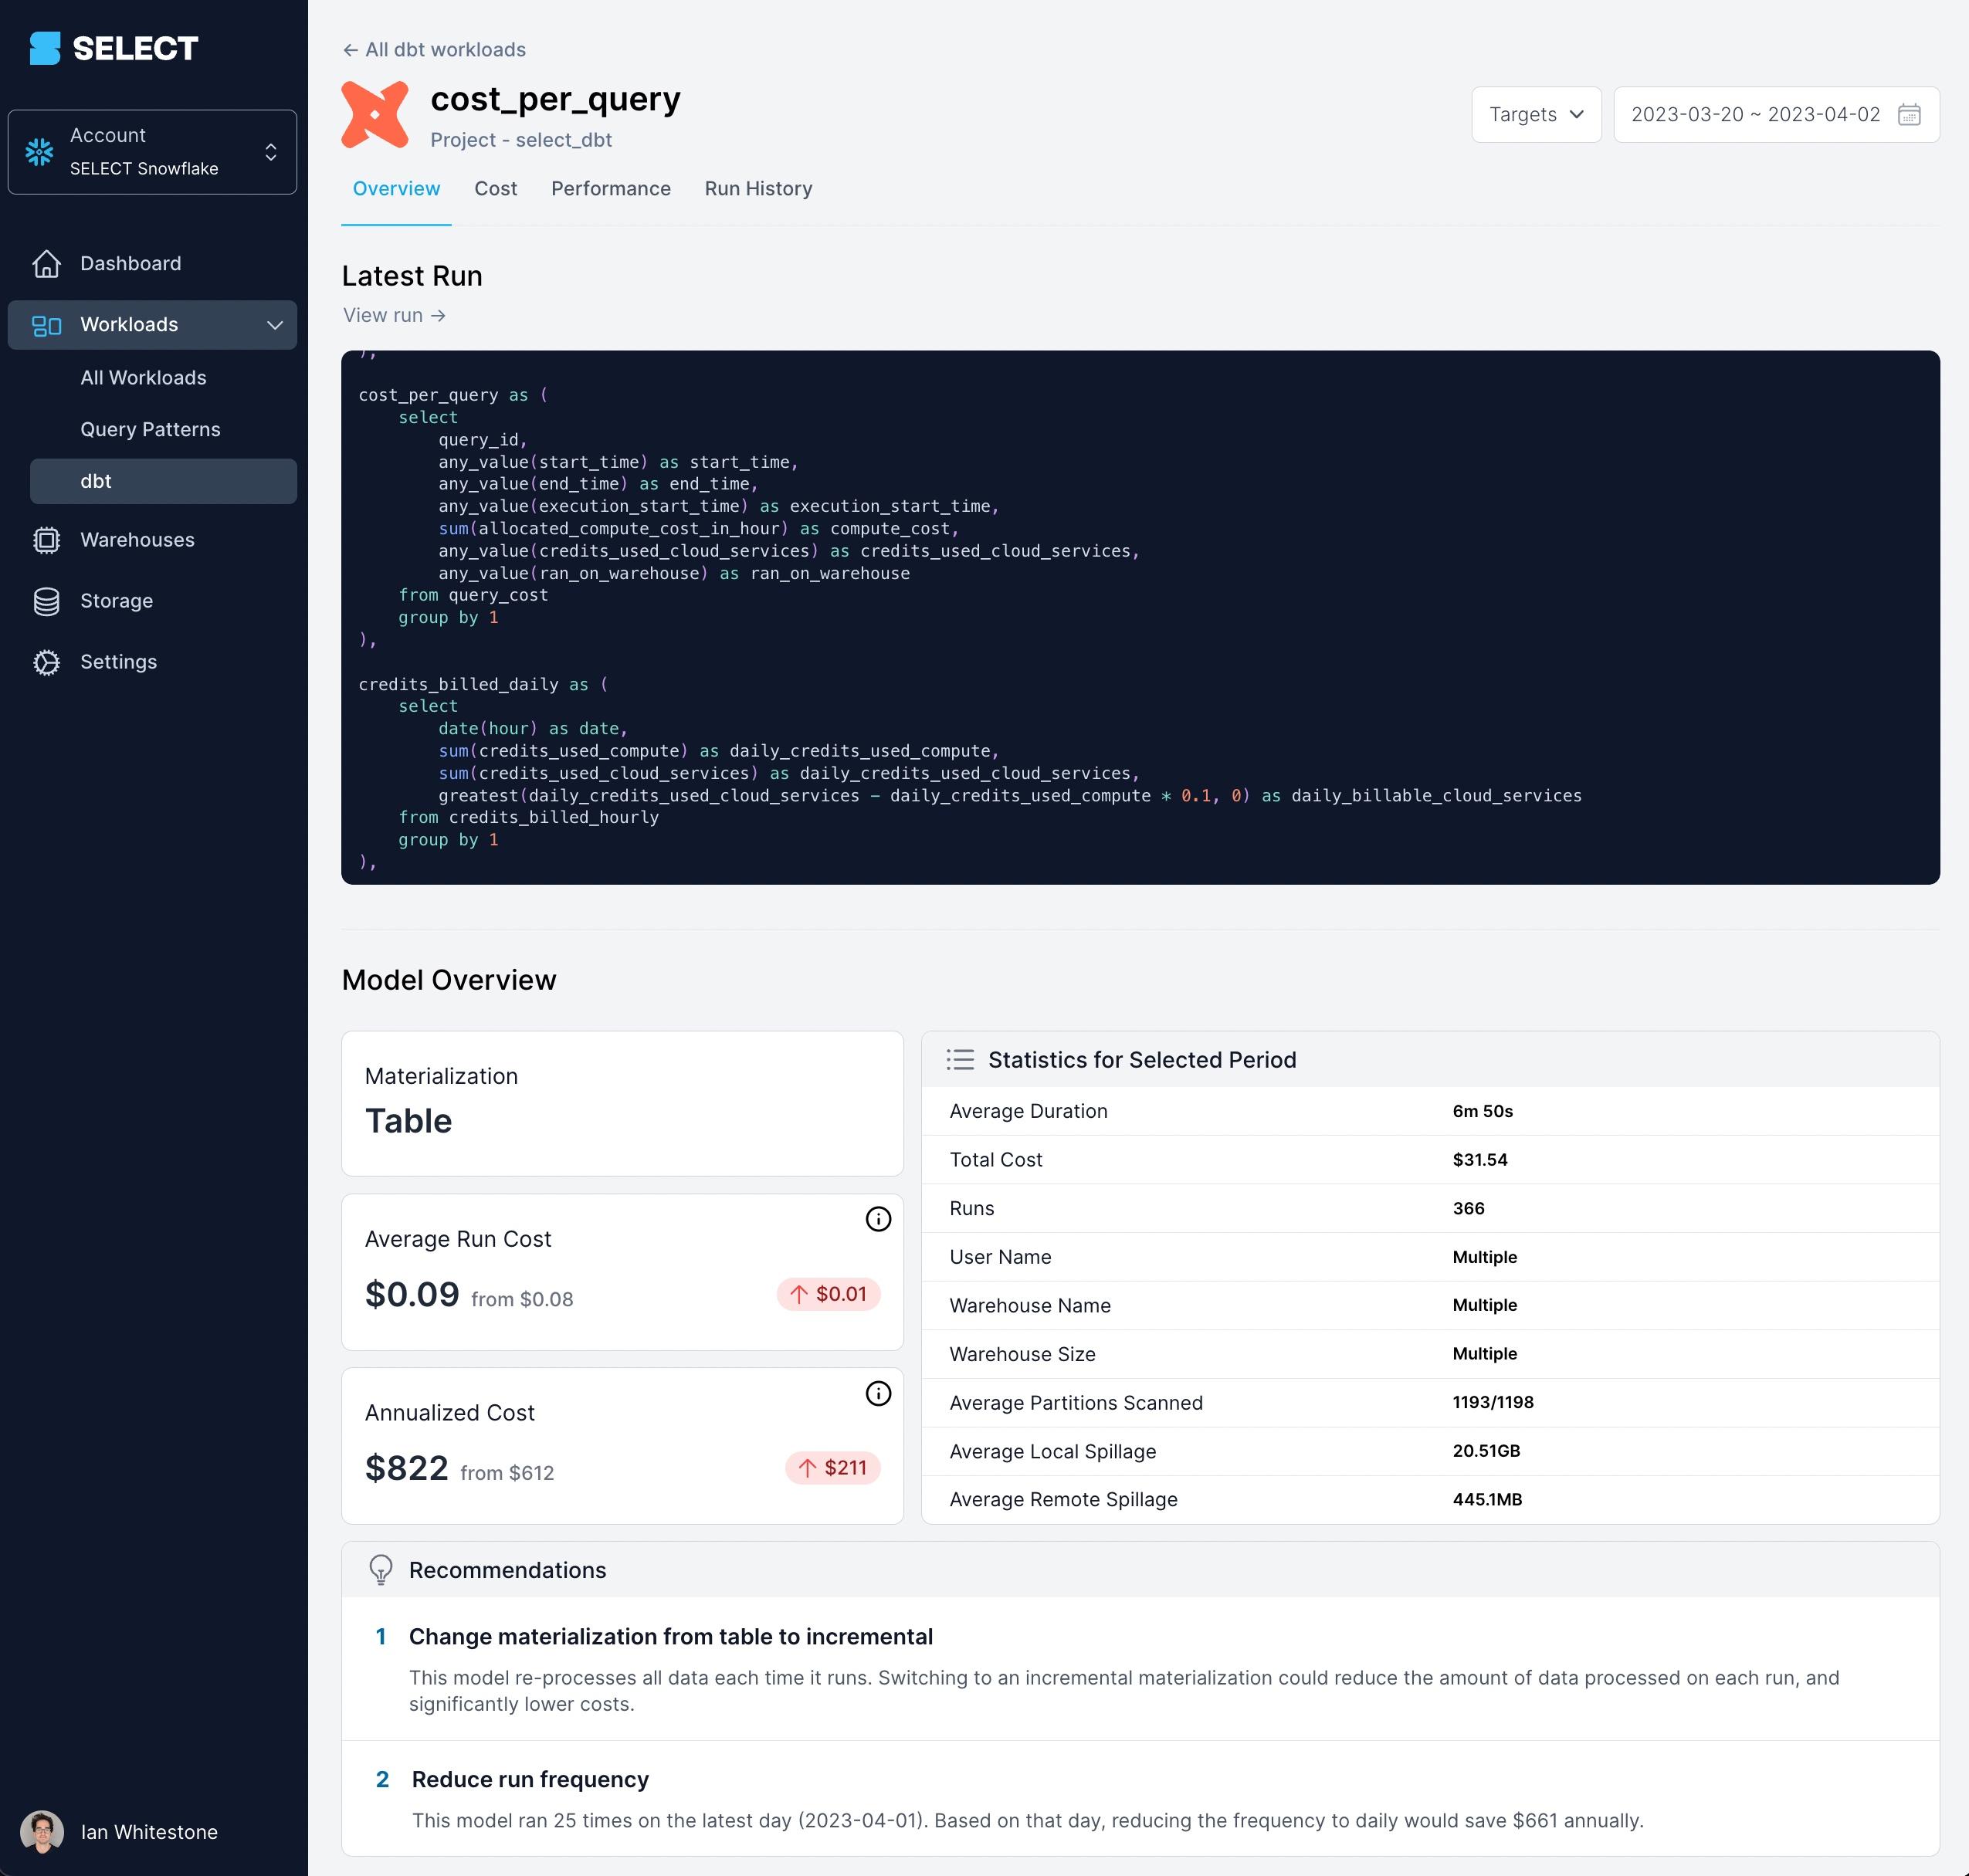
At SELECT, we leverage query tags & comments to allow our customers to monitor their dbt-issued queries by a variety of dimensions: environment, materialization, resource type, etc. Gaining this visibility is incredibly valuable, as it allows data teams to easily prioritize which dbt models require some extra attention. An example of how we surface this information in the product is shown below:
If you're looking to cut your Snowflake costs, want to get a better picture of what's driving them, or just want to keep a pulse on things, you can get access today or book a demo using the links below.

Ian is the Co-founder & CEO of SELECT, a SaaS Snowflake cost management and optimization platform. Prior to starting SELECT, Ian spent 6 years leading full stack data science & engineering teams at Shopify and Capital One. At Shopify, Ian led the efforts to optimize their data warehouse and increase cost observability.
Want to hear about our latest data cloud learnings?Subscribe to get notified.
Get up and running in less than 15 minutes
Connect your Snowflake, Databricks, or BigQuery account and instantly understand your savings potential.

