

Creating a new Monitor
To create a monitor, you must have at least “Editor” role in SELECT; viewers cannot create or edit monitors.
From the sidebar, click Monitors → + Create Monitor. Then either choose a template or click Continue without Template.
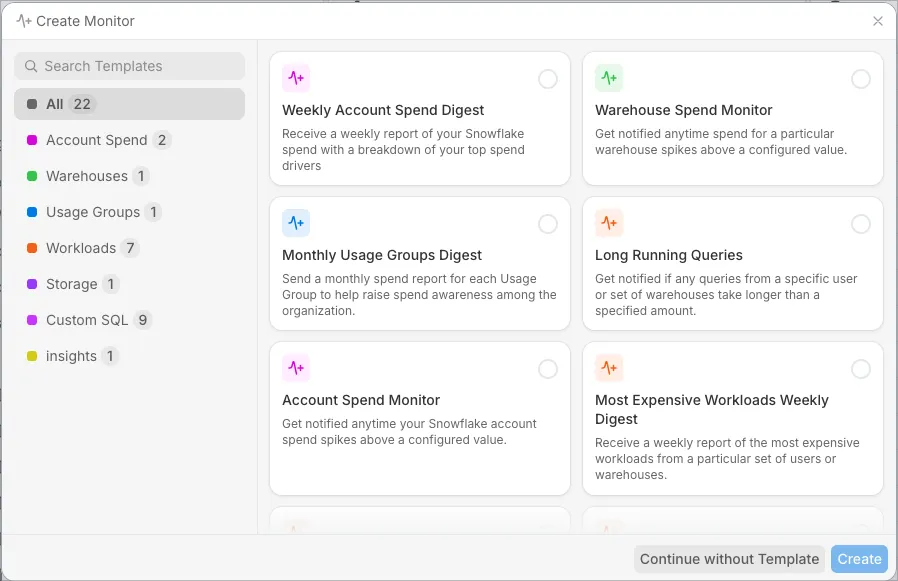
Templates help you get started quickly by pre-filling the form with common defaults. Templates are organized by category (e.g., Account Spend, Warehouses) as shown in the image above. They are just starting points; everything remains fully editable.
Monitor Configuration
After selecting a template (or continuing without one), you’ll configure the Monitor details. The steps below use the Warehouse Spend Monitor template as an example, but the workflow is the same in all cases.
Step 1: Data Sources
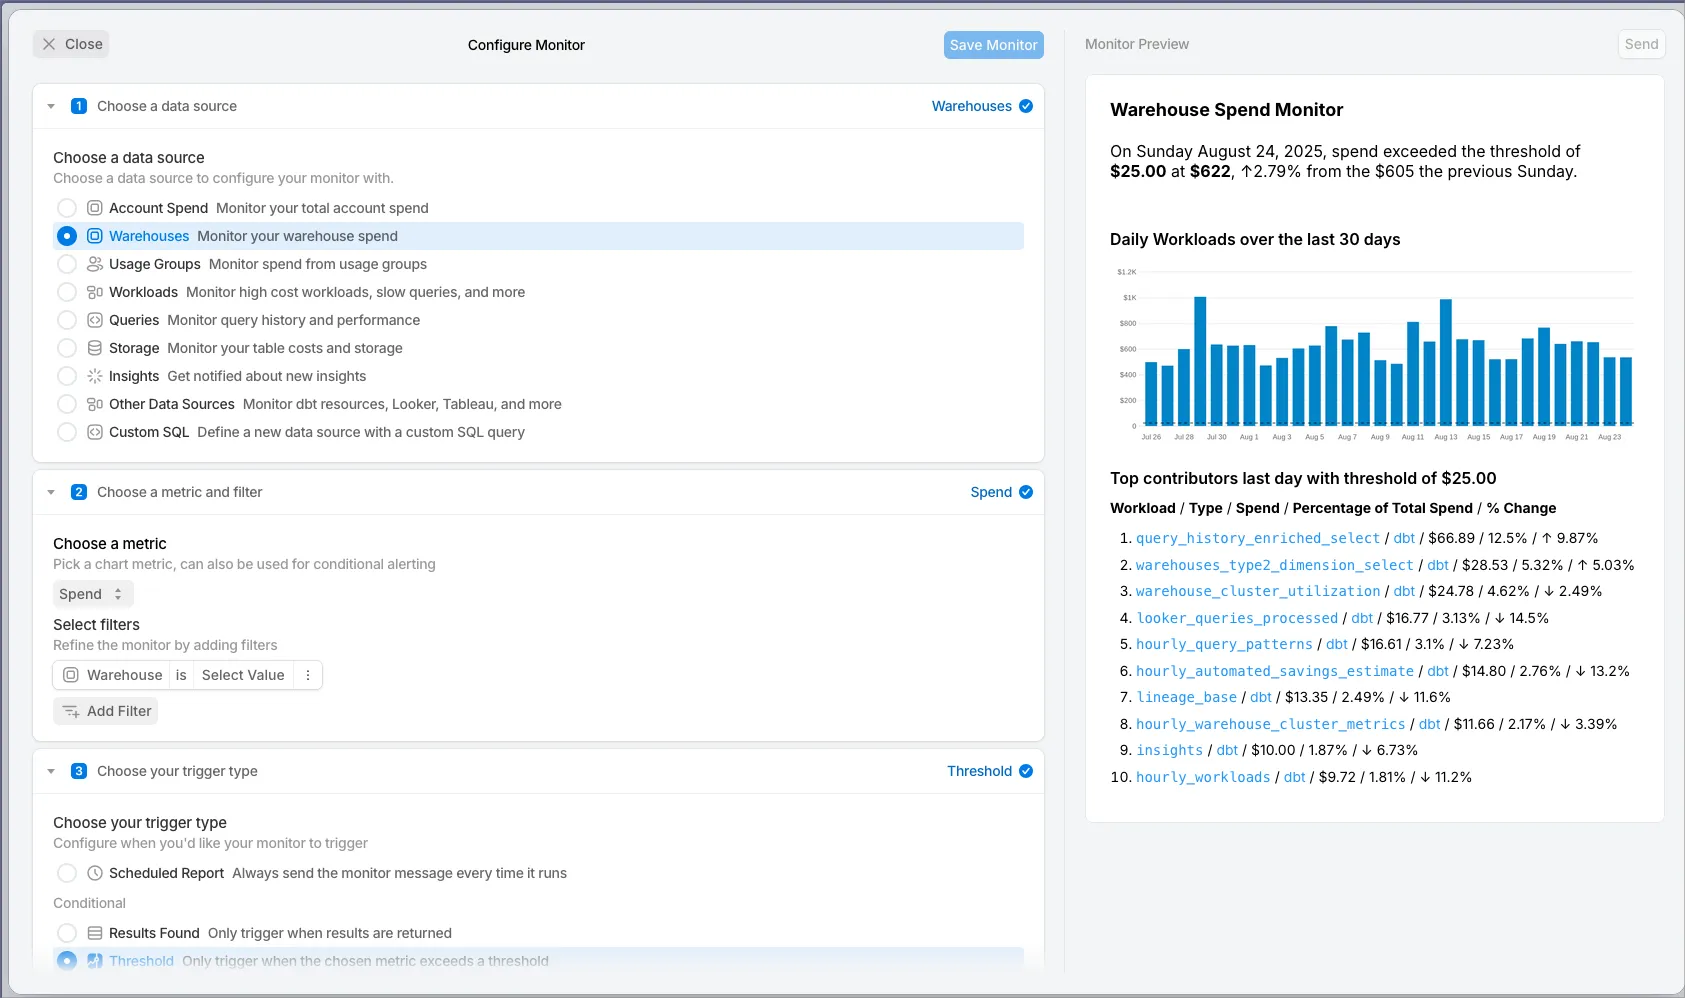
The first step is to choose a data source for the Monitor. Data sources align with the main pages in the SELECT app. In this example, the template has already pre-selected a data source, so we’ll leave it as is. Notice that the Monitor preview is already rendering on the right side of the page.
If you are creating a monitor from scratch, choose a data source, then continue.
Select a Partition Column (Optional)
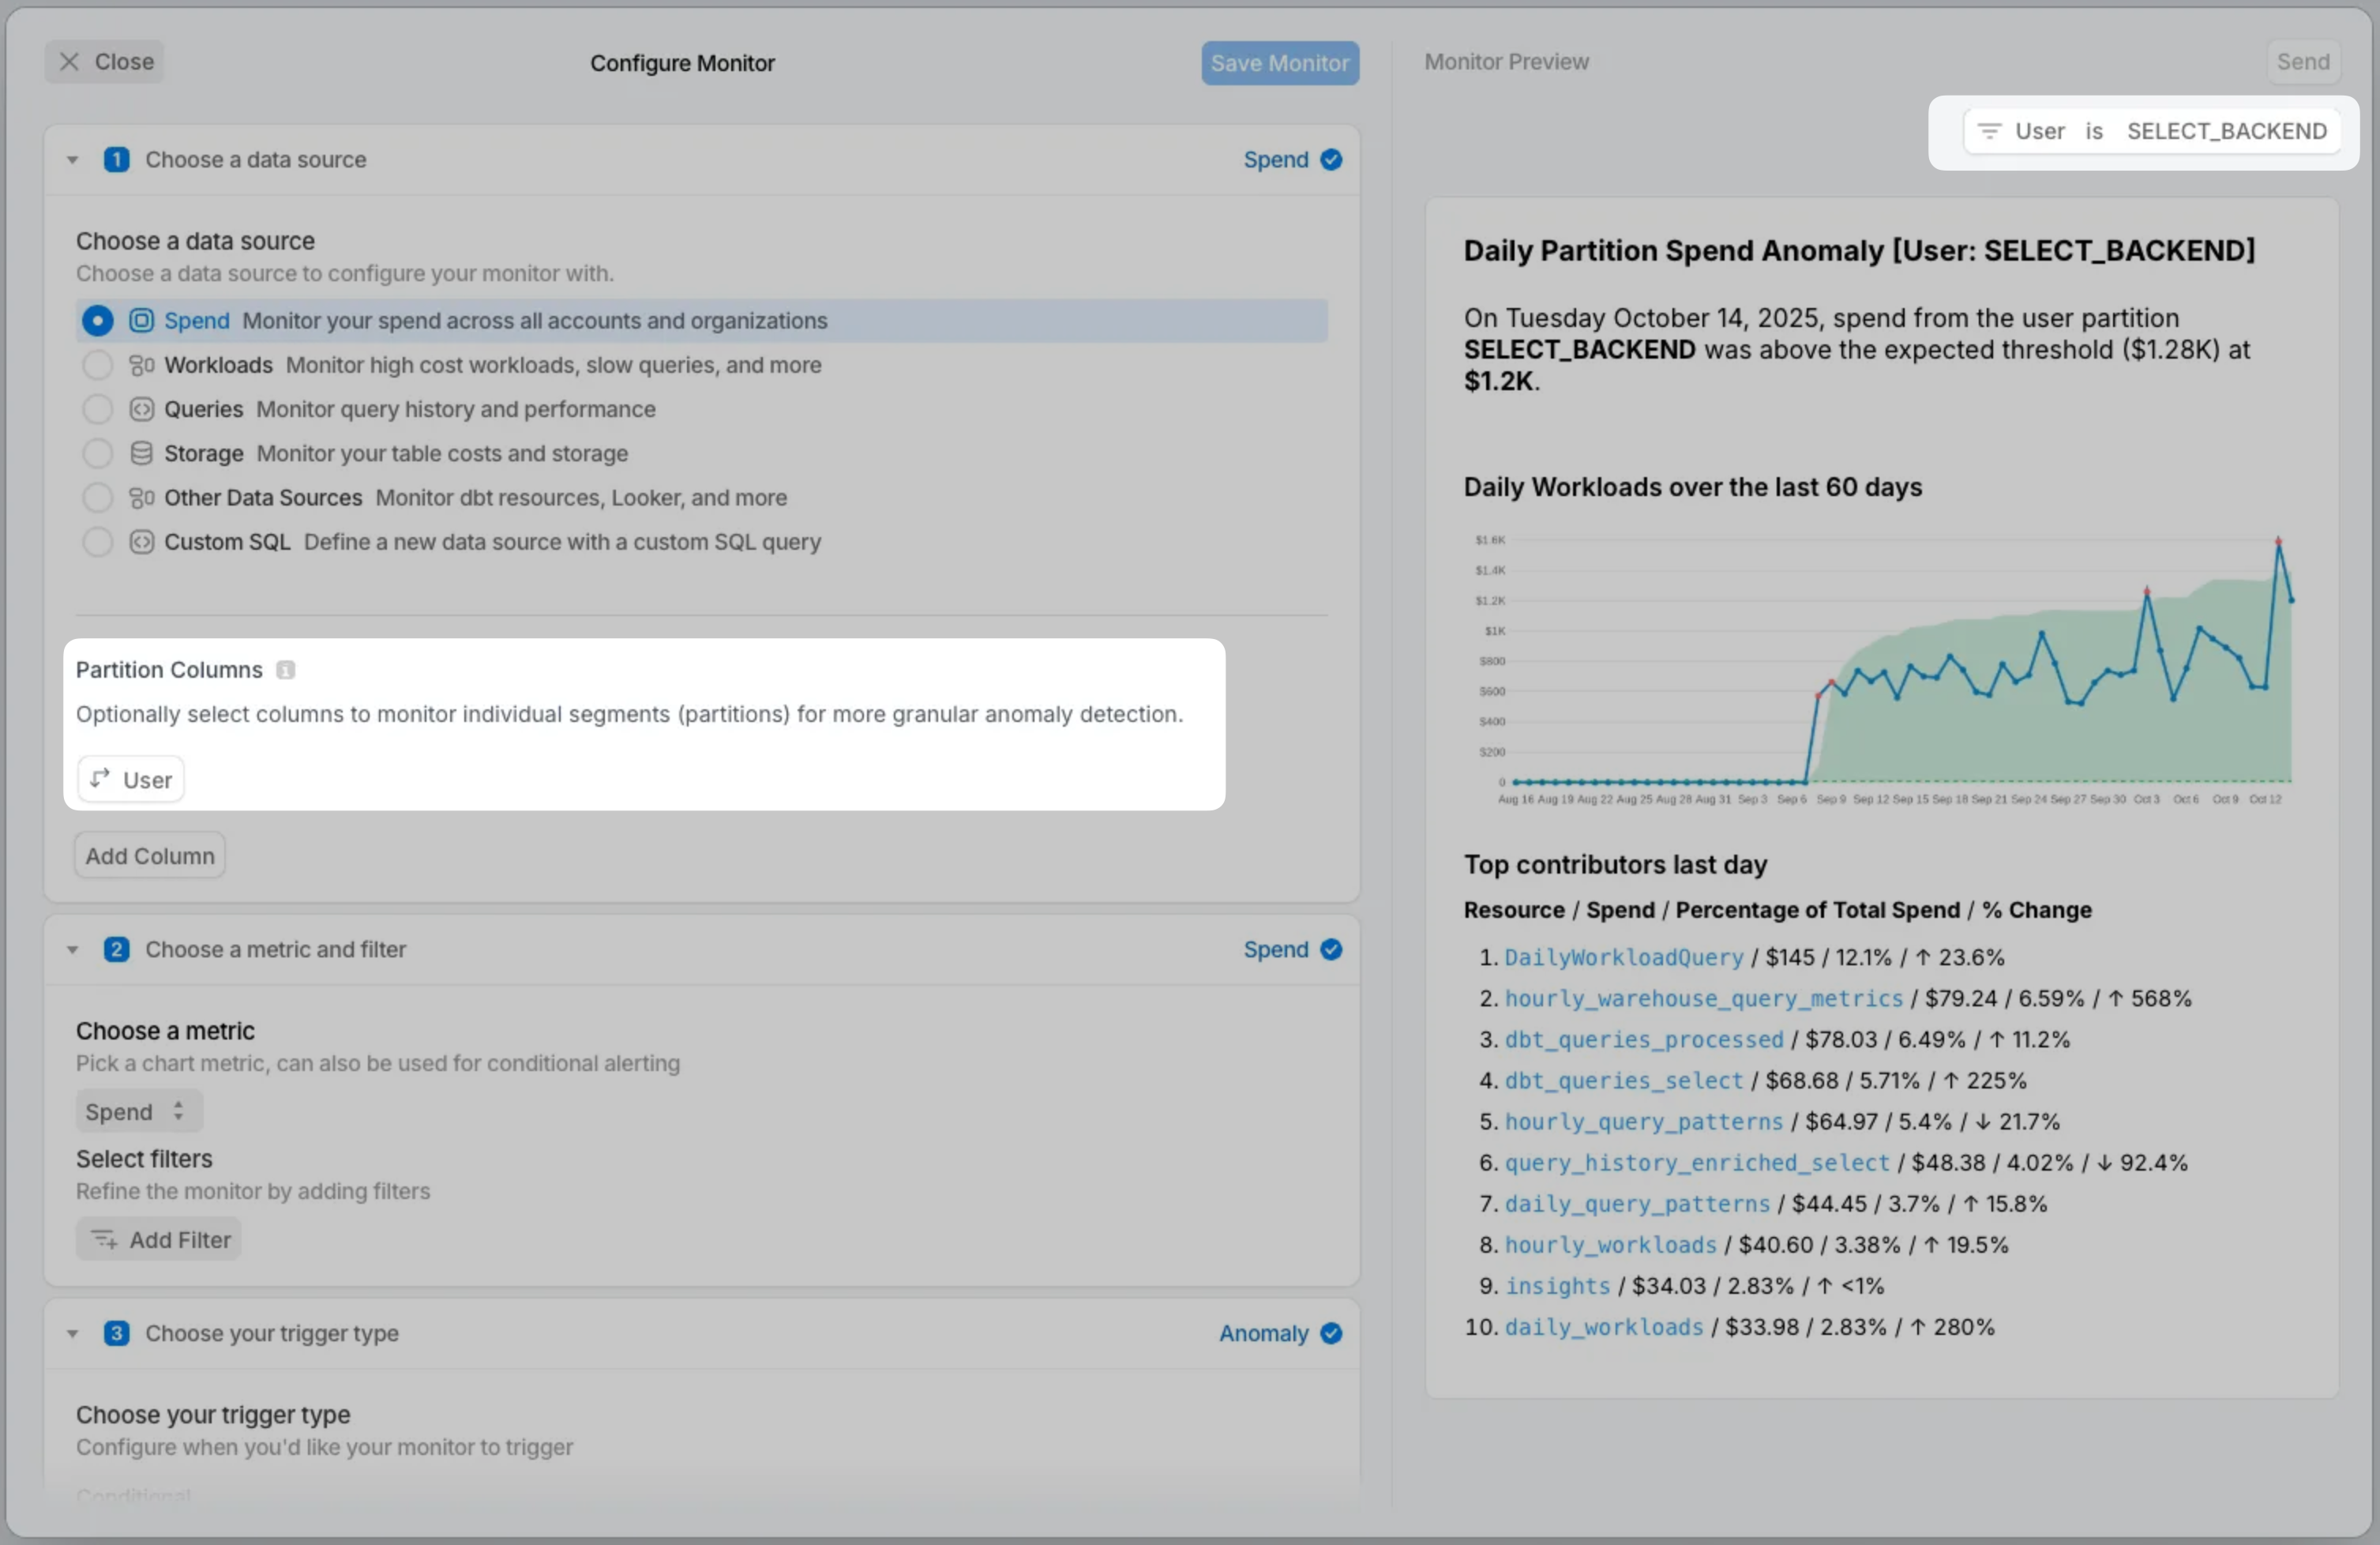
Partition monitors help detect more granular cost issues that would otherwise go unnoticed. They allow you to detect spend anomalies across individual Snowflake users, warehouses, databases, workloads, or any other dimension in SELECT! We will keep track of each segment's historical baseline and notify you if it deviates from that.
Example use cases:
- Notify me if any warehouse (new or existing) spikes above it's historical baseline
- Notify me if any users exceeds $100 in spend per day
- Notify me if any dbt model or dynamic table spikes abnormally in cost OR performance
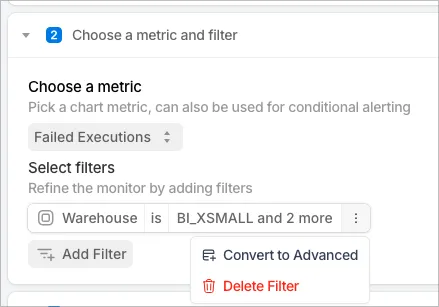
Step 2: Choose a metric and Filter
Metric Selection
For most data sources, you can monitor by any metric available in SELECT. Some data sources have fewer available metrics, for example, Account Spend can only be monitored by cost.
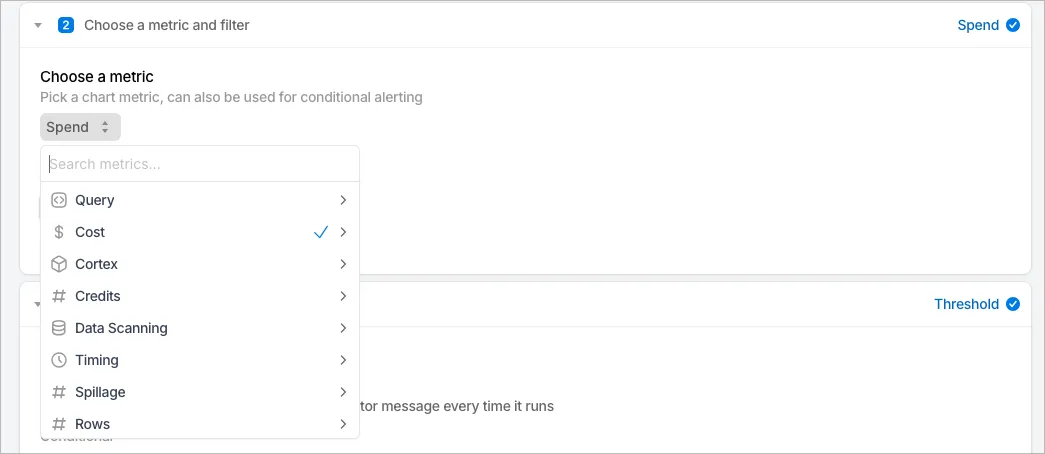
If you want to monitor failed query executions instead of spend, just change the metric; the preview updates instantly.
Filtering
The same filtering functionality available throughout SELECT is also available in Monitors. If you need grouped criteria with OR logic or more complex conditions, you can convert the filter into an advanced filter.
The preview continues to update with every change you make.
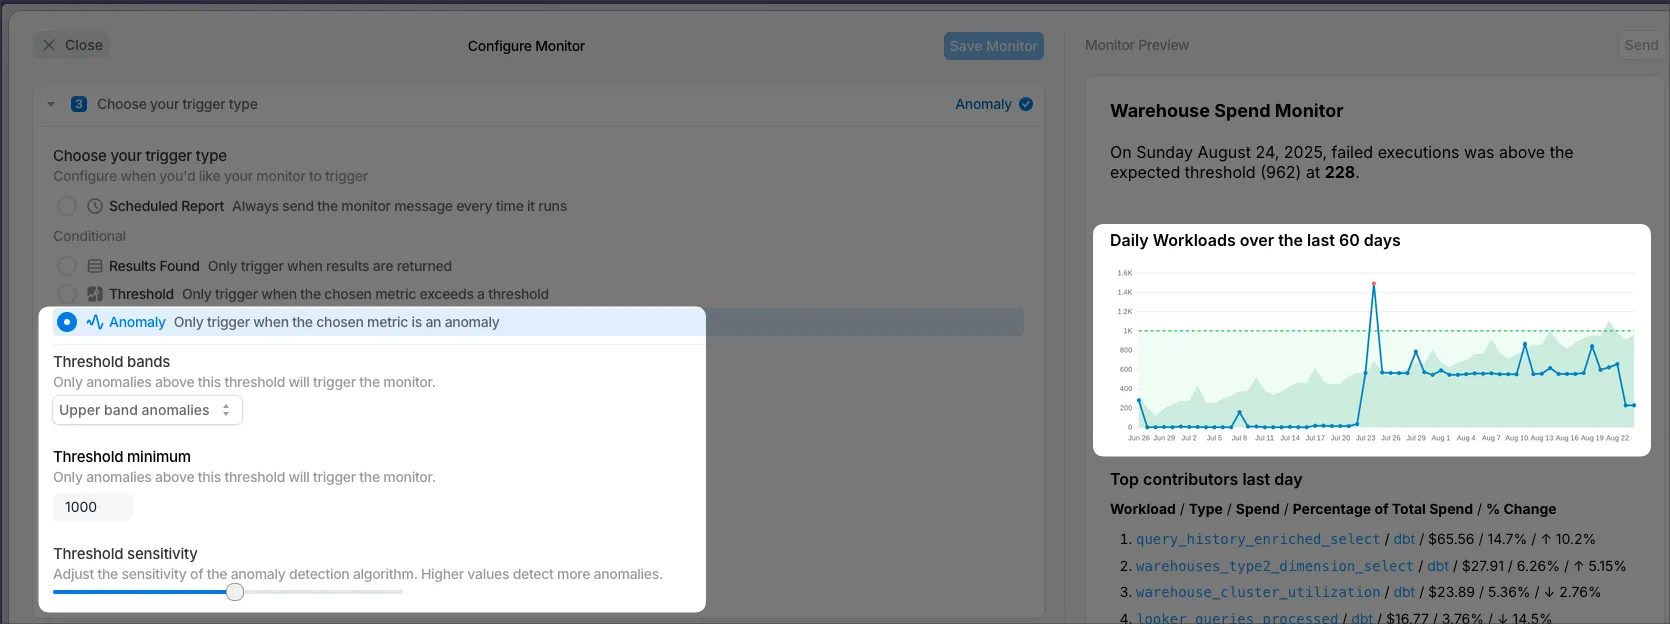
Step 3: Choose Your Trigger Type
Now choose the conditions under which the Monitor will run.
- Scheduled Reports: Send results on a fixed cadence that you specify in the next step. These send every time, even if no rows are returned. Use Results Found if you only want notifications for non-empty results.
- Conditional:
- Results Found: Notify only when results are returned.
- Threshold: Notify when a metric crosses a threshold. After entering the threshold, the value is automatically drawn on the chart in the preview.
- Anomaly: Detect abnormal highs or lows using machine learning. When you select this option, you must also configure threshold bands, minimums, and sensitivity.
Here is an example where the alert sends only if there are more than 1,000 failed queries and the number also crosses the anomaly band.
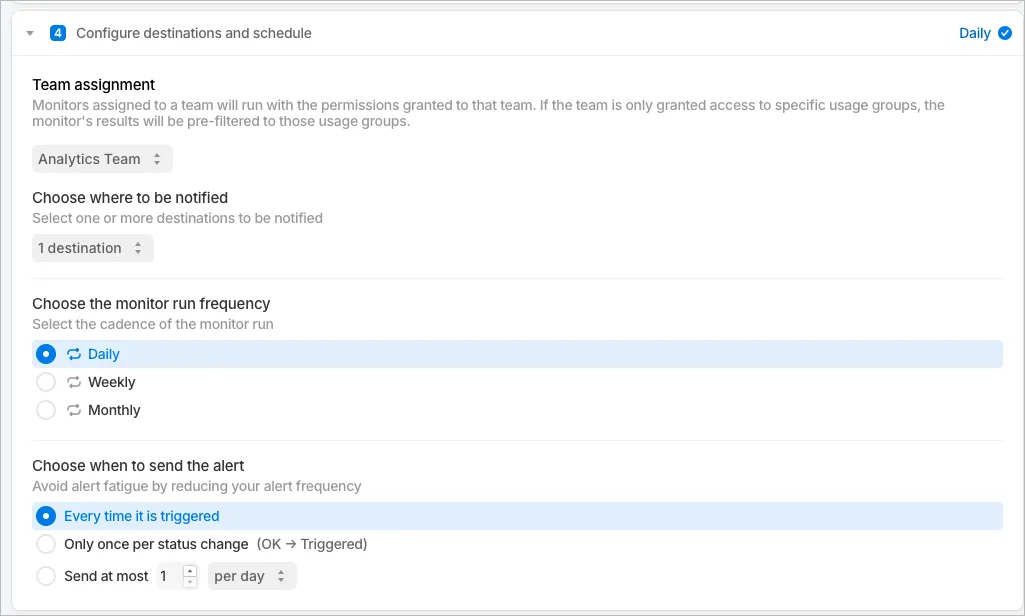
Step 4: Configure Destination and Schedule
In Step 4 you will find the following fields to be filled out.
- Team Assignment: Monitors assigned to a team run with that team’s permissions. If the team only has access to certain usage groups, results will be filtered accordingly.
- Choose where to be notified: Use the picker to choose from existing destinations or create new ones.
- Choose run frequency: Monitors run after your daily sync is complete. You can schedule them daily, weekly, or monthly. For core data sources, run them immediately after SELECT updates the data. Custom SQL Monitors run live in your Snowflake account and can use a cron expression.
- Choose when to send the alert: Here you will find 3 options:
- Every time it is triggered: Runs on the chosen schedule, following your thresholds and conditional logic.
- Only once per status change: Sends the first time the threshold is crossed. Dropping back below the threshold resets the status, so you will only get one alert per change. This reduces repeat alerts for the same issue.
- At most (x) per (frequency): For example, once per day. Another way to limit how often alerts are sent.
Step 5: Configure the Message
This step has several sections:
- Title: The name of the Monitor. This appears in the alert message and on the Monitors list page.
- Include Message: Toggle off if you do not want to include custom text in the alert.
- Configure your message: Use Markdown and Jinja to customize the body. By default this is pre-filled with Jinja to reference columns in your data.
- In custom SQL, reference columns directly with
{{ row.column_name }}. - Custom SQL Monitors are pre-filled to loop through all rows and columns returned.
- In custom SQL, reference columns directly with
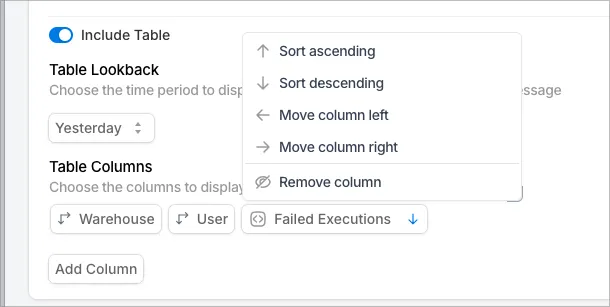
- Include Chart and Include Table: Disable these if you do not want a chart or table in the alert.
- Table Lookback: Defines the data window for non-SQL Monitors. The default is yesterday. Changing this automatically updates the table title so readers know the time range.
- Select Table Columns: Choose which columns to display. Click a column to remove it, or use Add Column to include another.
The tables will always return the top 10 results, so as you change metrics, be sure to update the sorting of the columns so the correct results are included.
Continuing the example of “failed query executions”, it makes sense to remove all Spend columns and instead group by Warehouse and sum the Failed Executions. In order to ensure that my top 10 results are shown, I must sort by “failed executions descending”.
This produces a finished preview:
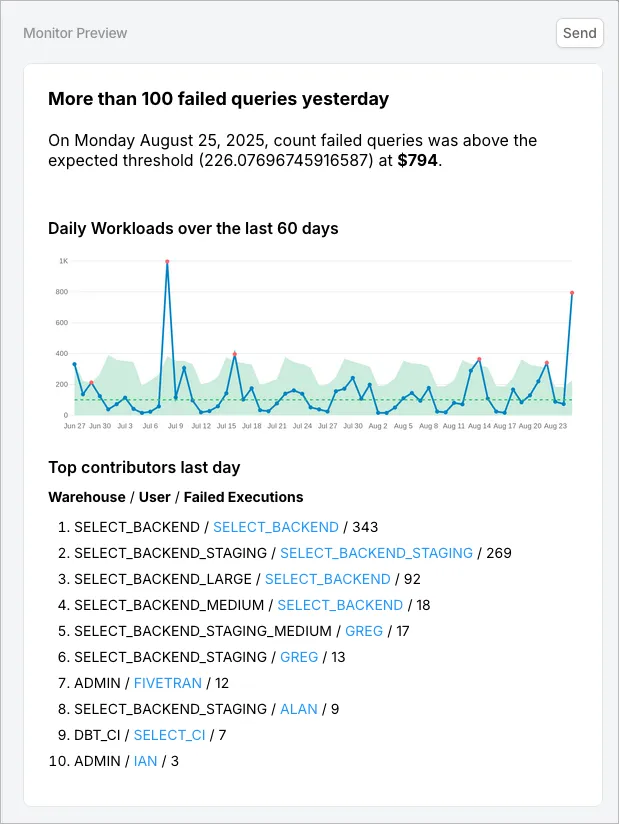
Send Preview and Save
Before saving the monitor, it is a good idea to send a test to the destinations. You can do this by clicking the Send button in the top right corner, also shown in the screenshot above.
Once you are satisfied, click the blue “Save Monitor” button.
Managing Existing Monitors
All of your existing monitors can be found on the Monitors page by clicking Monitors on the sidebar.
- Filter: Use the filter bar at the top to search for specific Monitors. You can also create a saved views and favorite here.
- Side Peek: Open the drawer to view details such as the preview, status, and run history. From here you can also click View Monitor to edit.
- Monitor name: Clicking the name in the main table takes you to the edit screen.
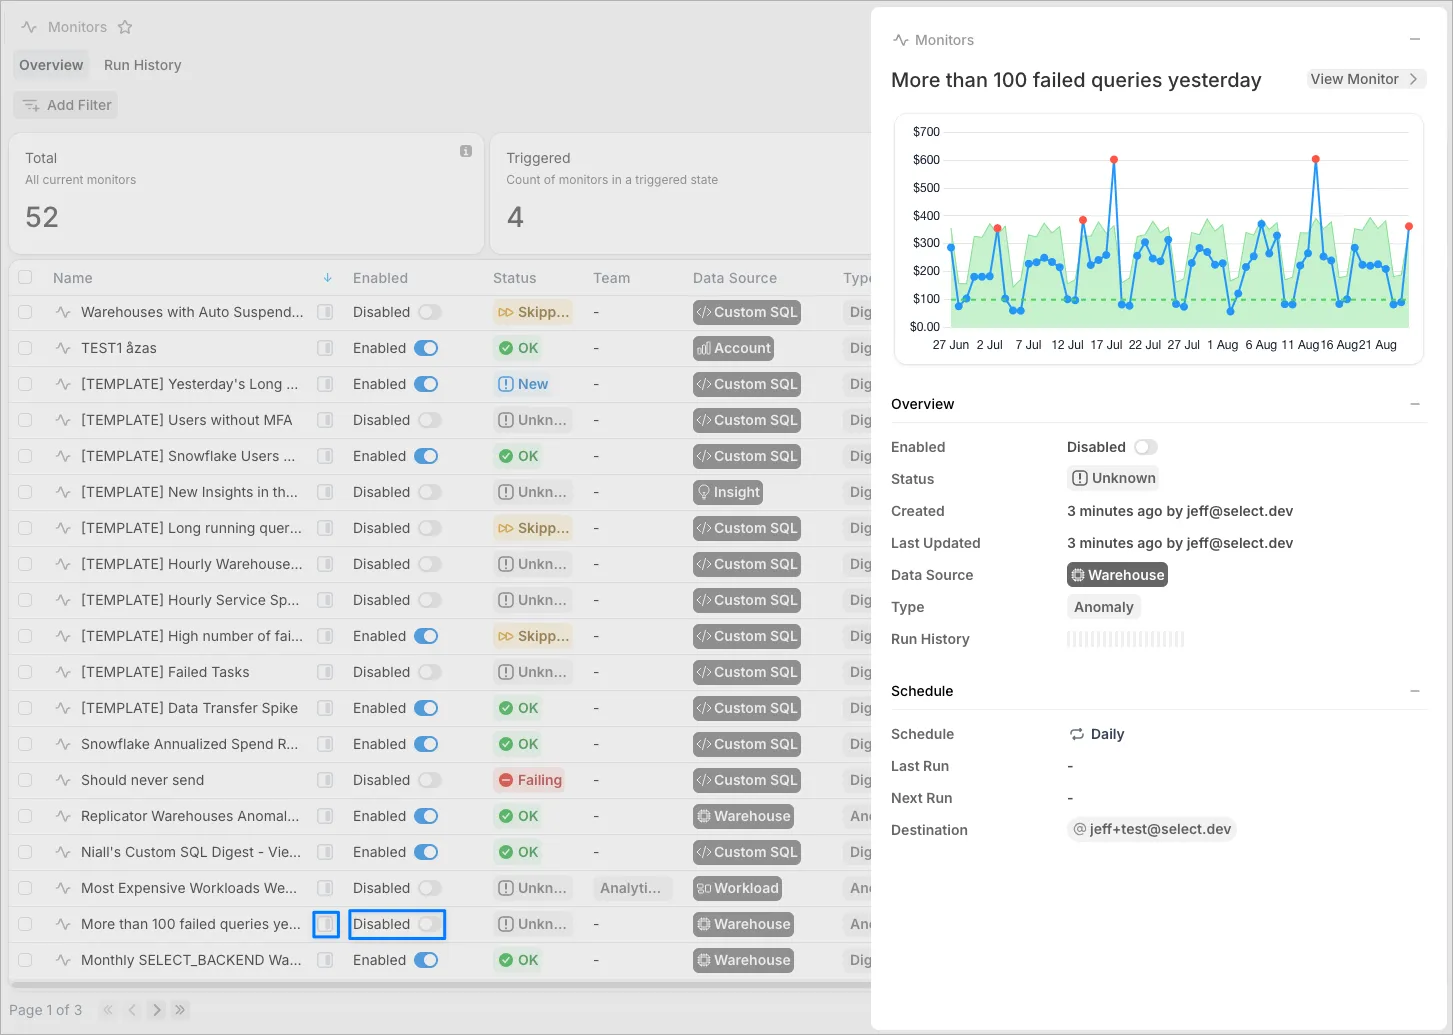
Enable / Disable monitors
Monitors can be enabled or disabled using the toggle in the main table on the monitors page or the side peek, or in the Edit Monitor screen.
Editing existing monitors
To edit a monitor, click the Monitor name in the table. The next page is broken up into 3 tabs:
- Overview: shows you a preview of the monitor, the recent runs, plus other stats about the monitor.
- Run History: Provides a full run history of the monitor, including the thresholds and observed values.
- Configuration: This is where you will edit your existing monitors using the same interface that is used to create monitors.

