Staying on top of a Snowflake environment is challenging. With thousands of active users, new workloads added every day, and complex data pipelines, it’s hard for platform teams to see everything happening in their account.
SELECT’s Monitors feature makes it easier. Monitors send timely notifications about critical events in your Snowflake account so you can respond quickly.
Monitor Types
A Monitor type is defined by two parts: a data source and a trigger condition.
Data sources available in SELECT:
- Account Spend – Track spend across an entire account.
- Warehouses – Monitor metrics such as spend, credits, query executions, and more, for one or multiple warehouses.
- Usage Groups – Track spend by Usage Group.
- Workloads – Monitor high-cost workloads, slow queries, and related activity.
- Queries - Your Snowflake query history enhanced with SELECT data, such as Usage Groups, Workloads, etc.
- Storage - Table and Stage storage billed by Snowflake.
- Insights - Our custom insight categories as seen on the Insights page.
- Other Data Sources – dbt, Looker, Tableau
- Custom SQL – Define your own query as the source.
Trigger Conditions:
- Scheduled Report – Send results on a set schedule.
- Conditional Monitors:
- Results Found – Only notify when the query returns records.
- Threshold Monitors – Notify when a metric exceeds a specific threshold within a time period (ideal for spend spikes, performance regressions, and more).
- Anomaly Monitors – Use machine learning to detect abnormal values automatically, factoring in seasonal patterns. Compared to Threshold Monitors, they don’t require manual tuning, though you can adjust sensitivity to balance detection speed with false positives.
See the Managing Monitors page for details on creating and managing each type of monitor and trigger conditions.
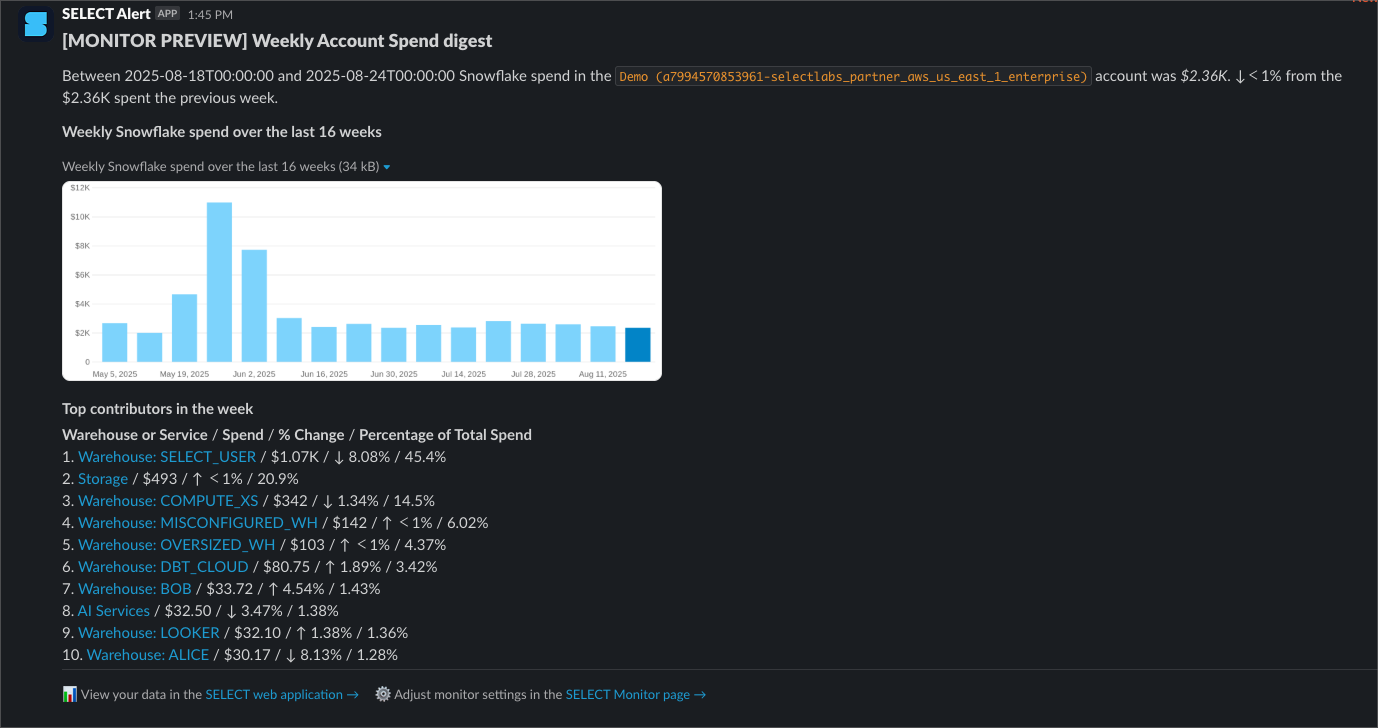
Example Monitor Results
Here’s how a Monitor notification looks in Slack (with similar previews in Teams and Email):