Actions & Savings
Actions let you record every cost-saving change you make and measure its impact on your bill over time. They are the system of record for optimization work in SELECT — similar to tickets in Linear or Jira, but tied directly to your spend, so you can prove impact instead of estimating it.
Actions come from two sources: ones you log by hand, and ones SELECT logs automatically for its automated-savings features. In most accounts the automated ones are the majority of what you'll see.
Where to find Actions
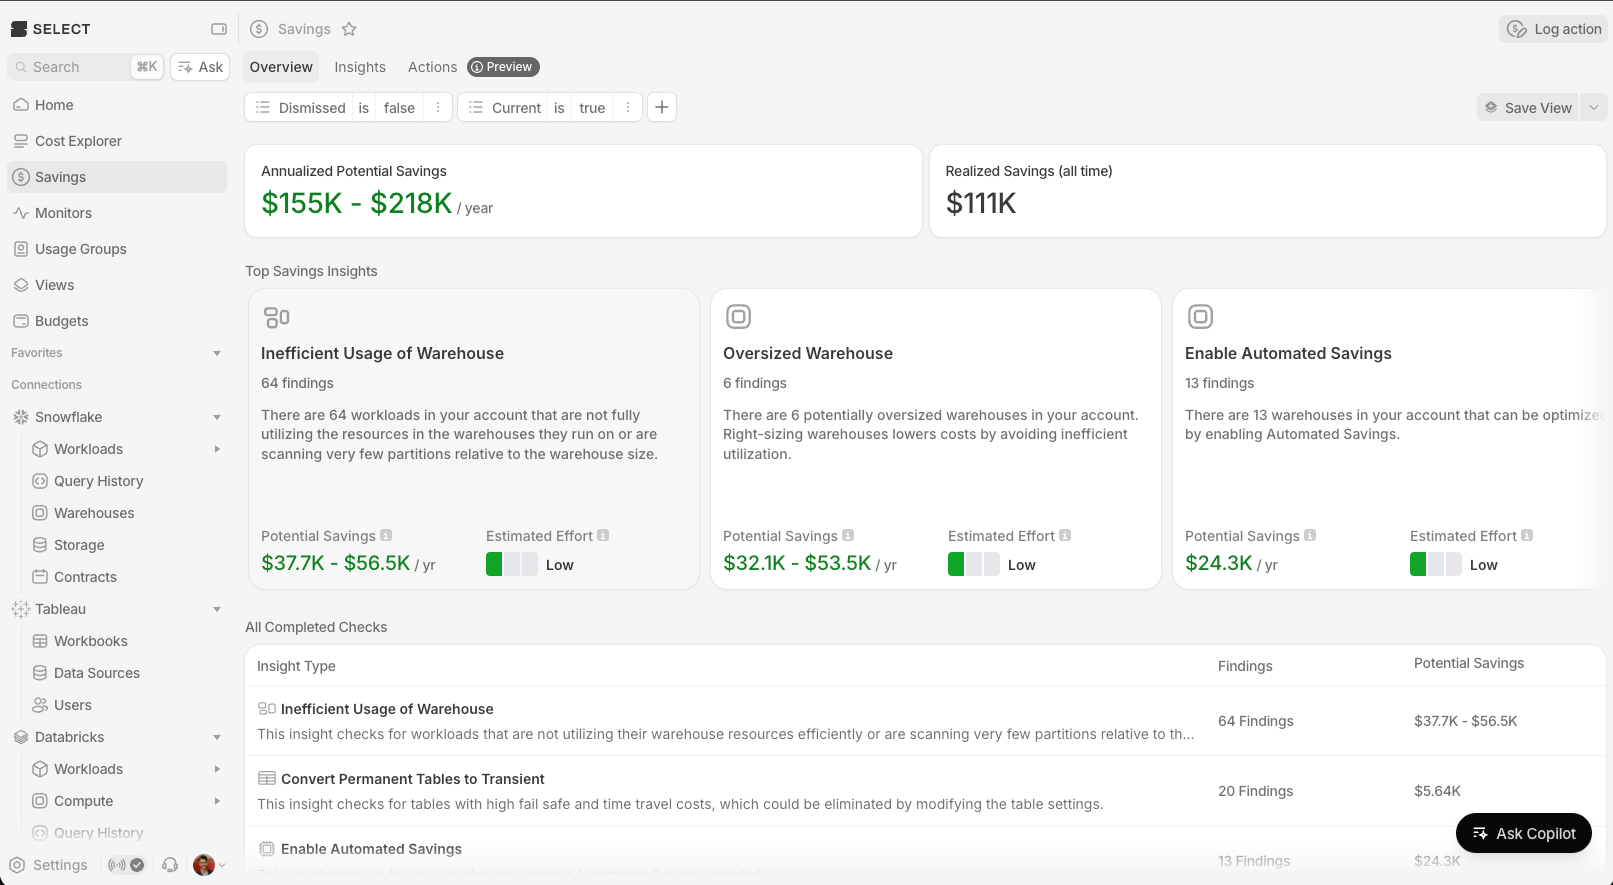
Actions live under the Savings section of the sidebar.
Savings has three tabs:
- Overview — a dashboard showing total realized savings, projected savings, and a leaderboard of who's logging the most actions.
- Actions — the full list of logged actions with filtering, grouping, and summary metrics.
- Insights — cost-optimization recommendations that you resolve by logging an action.
Actions also appear in a few other places:
- Insight detail drawers — each insight shows related actions and a quick Log Action button.
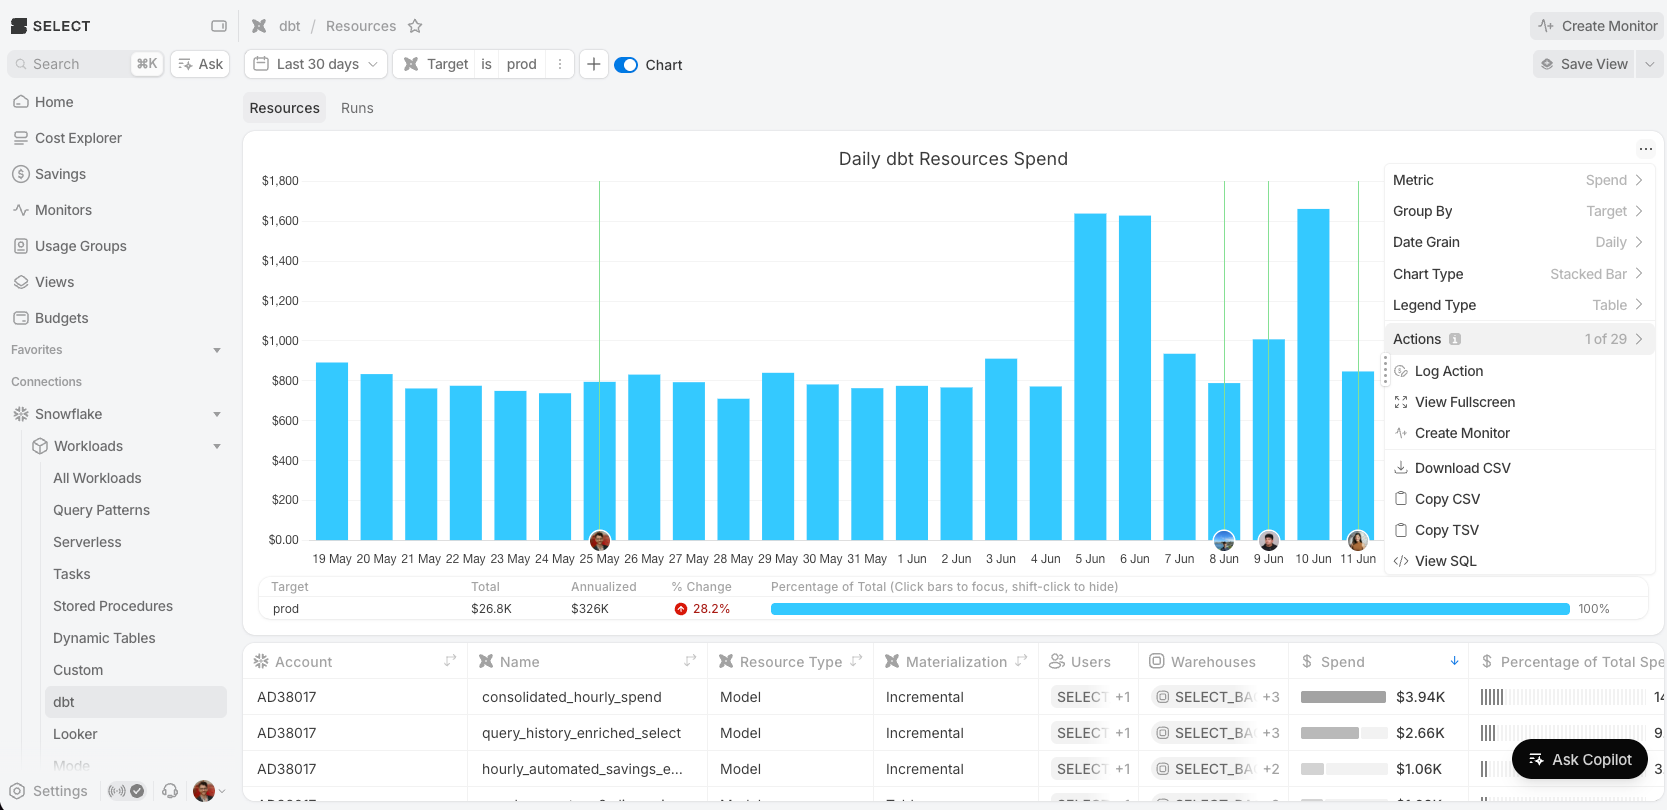
- Spend charts — top-level charts show actions for all resources as circles on the x-axis; resource-specific charts show just that resource's actions. By default a chart shows only the relevant action types, but you can adjust any chart through the chart menu (a simple show/hide on resource charts, or a multi-select of action types on top-level pages).
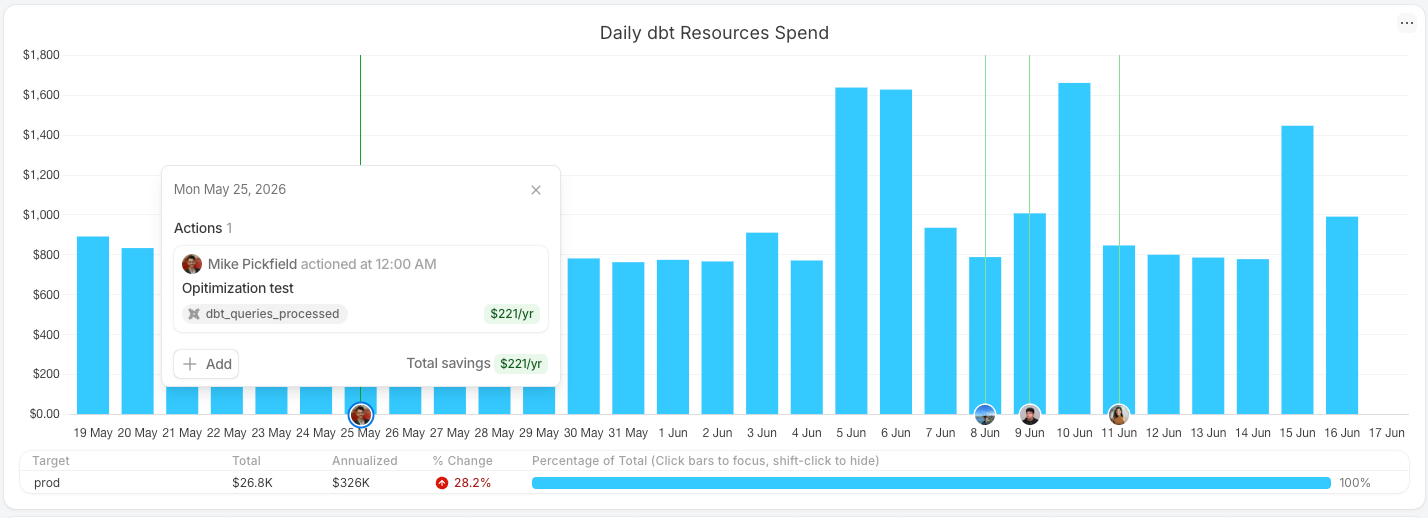
Hovering an action marker opens a panel listing the actions at that date and their combined annualized savings, with an Add button to log a new action pre-filled with that resource and date.
Logging a new Action
Click Log Action in the Actions tab header to open the creation modal. You can also click the chart to pin the tooltip and add an action for that day, which pre-fills the date.
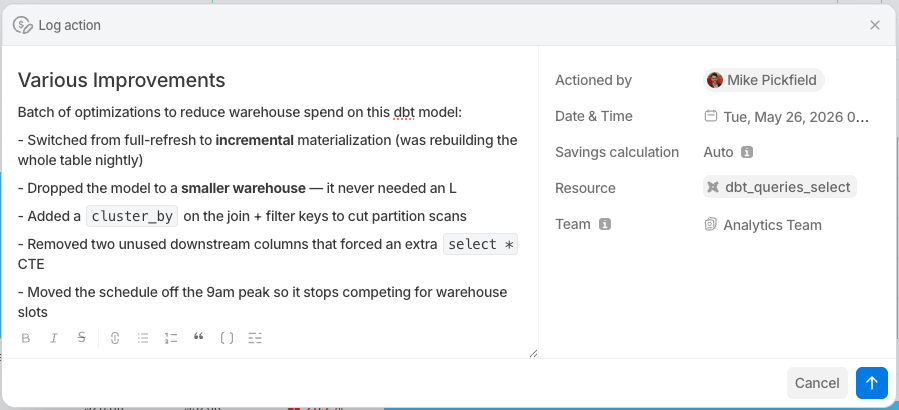
Action fields
- Title — a short name for what you did (e.g. "Downsize ANALYTICS_WH to Medium").
- Scope — whether the action applies to a specific resource or globally (see below).
- Actioned by — the team member who took the action.
- Date of action — when the change took effect. SELECT uses this as the before/after boundary for measuring impact. Can't be in the future.
- End date (optional) — when the action stopped being in effect. Leave blank for an ongoing change; set it to bound a finished experiment (see Start and end dates below).
- Description (optional) — any additional context about the change. Supports Markdown.
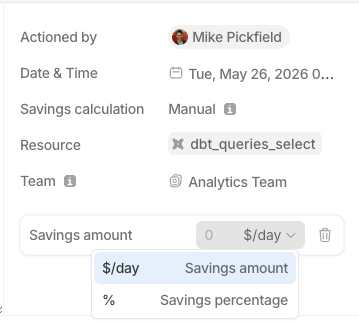
- Savings type — how savings are tracked: Automated or Manual (see below).
- Savings amount (manual only) — your savings estimate, entered as either a flat dollars-per-day or a percentage of the resource's spend.
- Team (optional) — the team the action belongs to; controls who can see it. Required if you don't have org-level write permission.
Start and end dates
The date of action marks when the change took effect — the start of the action's effective period. The end date is optional and marks when it stopped.
Set an end date when you're running an experiment and want a clean picture of what the change cost or saved during a bounded window. Once an action has ended, SELECT stops accruing new daily savings for it and freezes its realized total. Leave the end date blank for changes still in effect.
Scope: Resource vs Global
Resource scope ties the action to a specific resource (warehouse, query pattern, storage, etc.). This is what enables automated savings — SELECT compares the resource's spend before and after the action date.
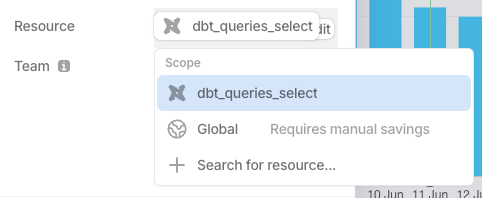
Global scope is for changes that affect overall spend but aren't tied to a single trackable resource — e.g. "Implemented org-wide query governance," sunsetting an untracked account, or renegotiating your contract. Because there's no single resource to measure against, global actions require manual savings: when you pick Global, the savings type switches to Manual and Automated is disabled, and you must enter a flat dollars-per-day amount (percentage savings aren't available for global actions).
Savings type: Automated vs Manual
- Automated — SELECT compares your resource's average daily spend before and after the action date to estimate savings. Requires a resource-scoped action and about a week of post-action data before a result appears (see below). Default for resource-scoped actions.
- Manual — you enter the savings yourself, as either a flat dollars-per-day or a percentage of the resource's spend. Use this to override the automated estimate when you have a better number, or when the resource's usage is too irregular for the before/after comparison to be trustworthy.
Global-scope actions always use manual flat-dollar savings, since there's no specific resource to measure.
Who can see an action
Anyone with write permission can log an action against any resource. Visibility depends on team scoping:
- Scoped to a team — visible to members of that team, plus organization-wide viewers.
- Not attributed to a team — visible only to organization-wide viewers.
SELECT picks a default team for you in the UI, which you can change. Note that SELECT doesn't have a strict notion of teams owning resources, so team scoping is a manual choice rather than something inferred from the resource — pick the team that should see the action.
Automated savings actions
When automated savings is enabled on a Snowflake warehouse or Databricks resource, SELECT automatically logs an action whenever the automation makes a change, so savings from automation are tracked alongside the changes you log by hand. These auto-generated actions behave like any other and appear in the same lists and charts.
Who they're attributed to. Historical automated-savings actions were backfilled and are attributed to an automated-savings system user. Going forward, a new automated-savings action is attributed to the actual user who toggled the feature on.
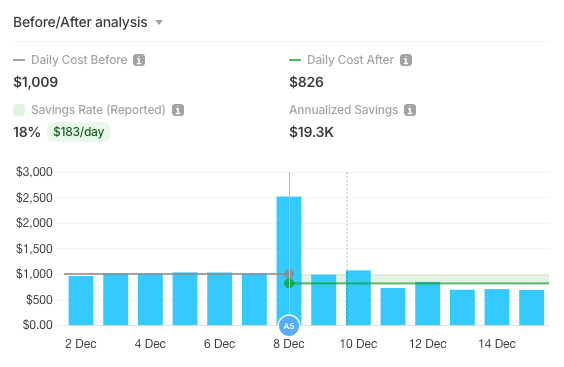
A different savings methodology. Because SELECT operates these features, it doesn't rely on the before/after comparison alone. The automated-savings service reports the savings it actually achieved — and that report is often conservative and under-counts. So the savings shown for an automated-savings action can be a blend: a floor from what the service reports, combined with the before/after percentage when that's higher.
A practical consequence: an automated-savings action can still show savings even when the before/after comparison would land at 0% (e.g. because spend fell under the minimum-spend floor described below). The service's own conservative day-to-day estimate carries through instead of being zeroed out.
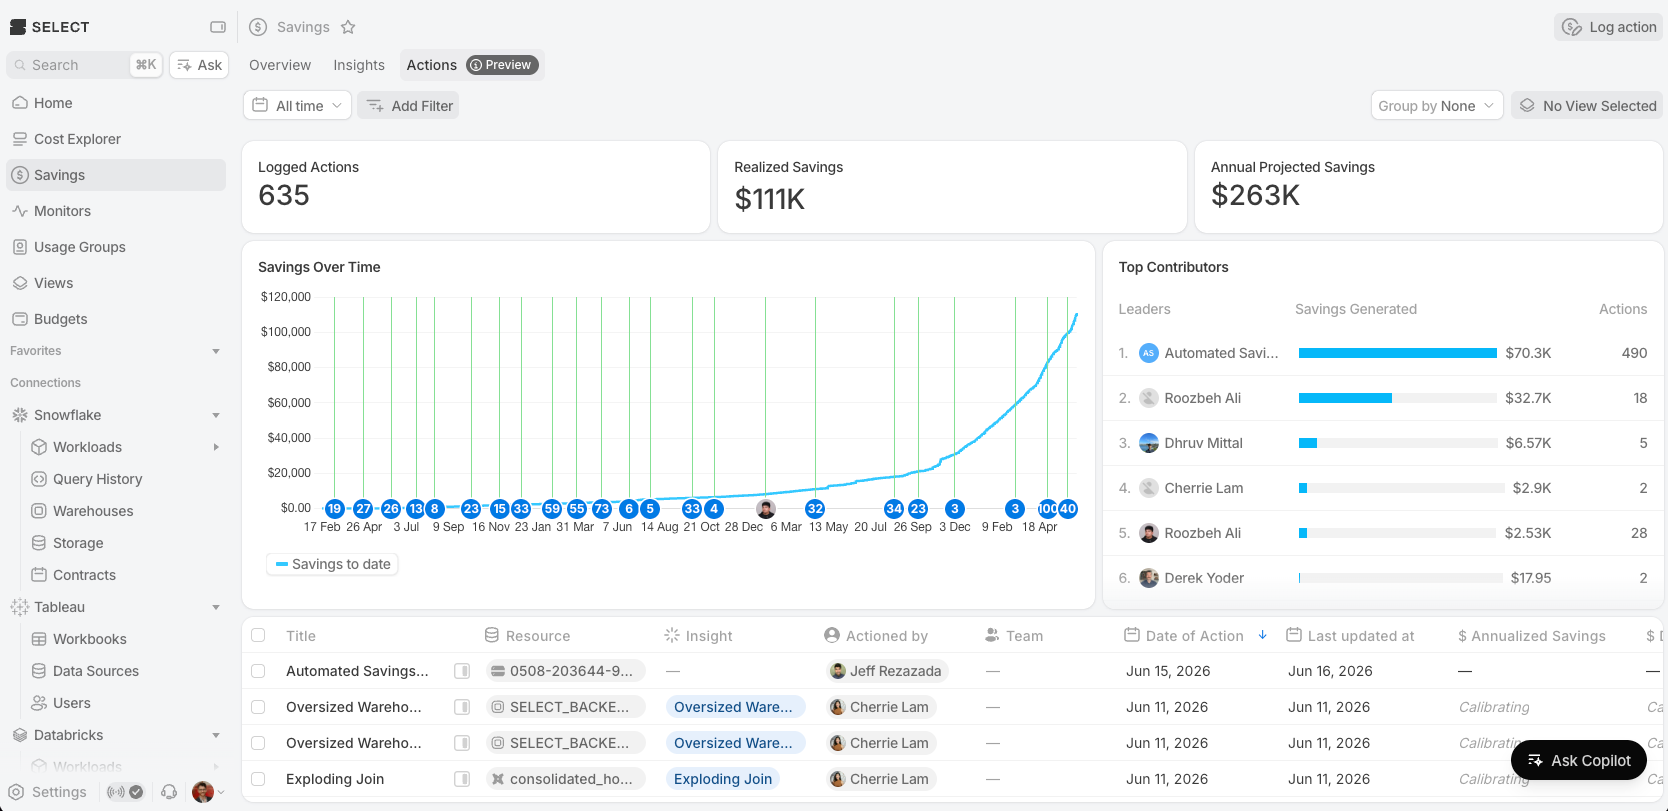
Savings Overview dashboard
The Overview tab gives a high-level view of your team's optimization impact.
Actions tab
The Actions tab shows all logged actions in a filterable table; each action can also be opened in a side pane.
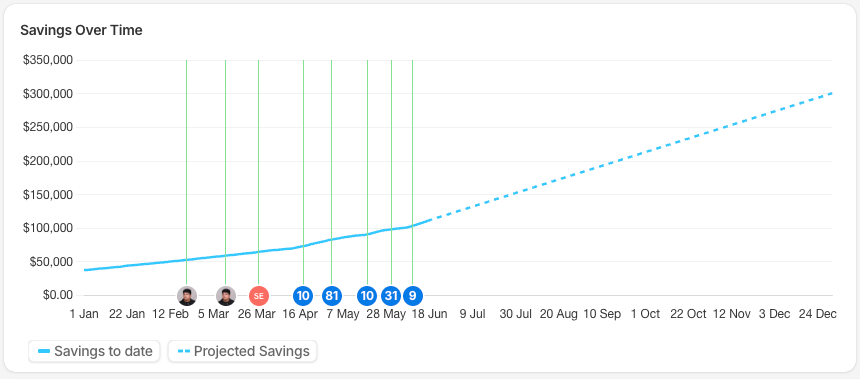
Realized Savings chart
A time-series chart of cumulative savings over time. The solid line is actual realized savings up to today; the dashed line projects savings forward based on your current daily rate.
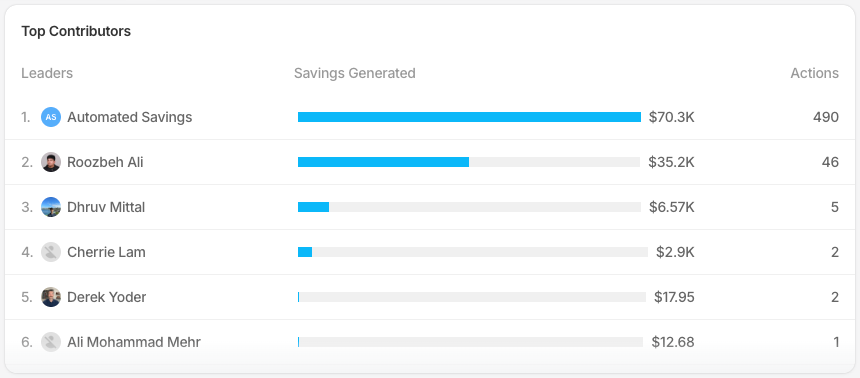
Logged Actions Leaderboard
A ranked list of team members by number of actions logged and total savings attributed — recognizing who's actively optimizing spend.
Filtering. Use the inline filters above the table to narrow by title, resource, user, insight type, savings type, or date range.
Grouping. Use the Group by dropdown to organize actions (by savings type, resource type, team, and more).
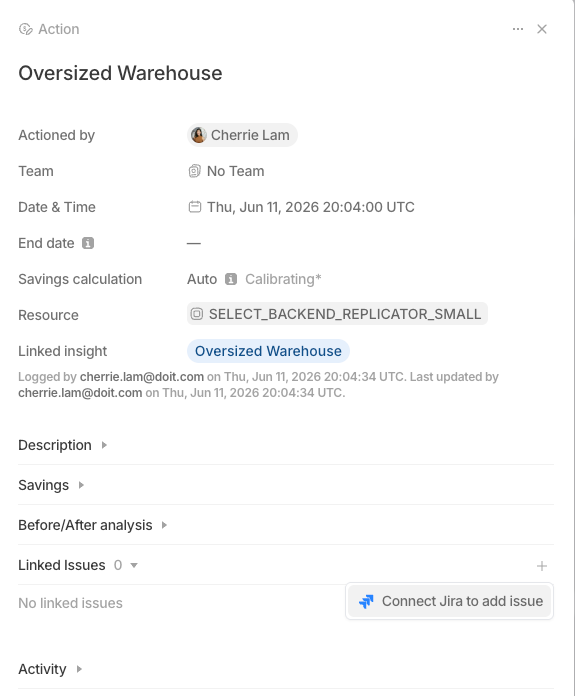
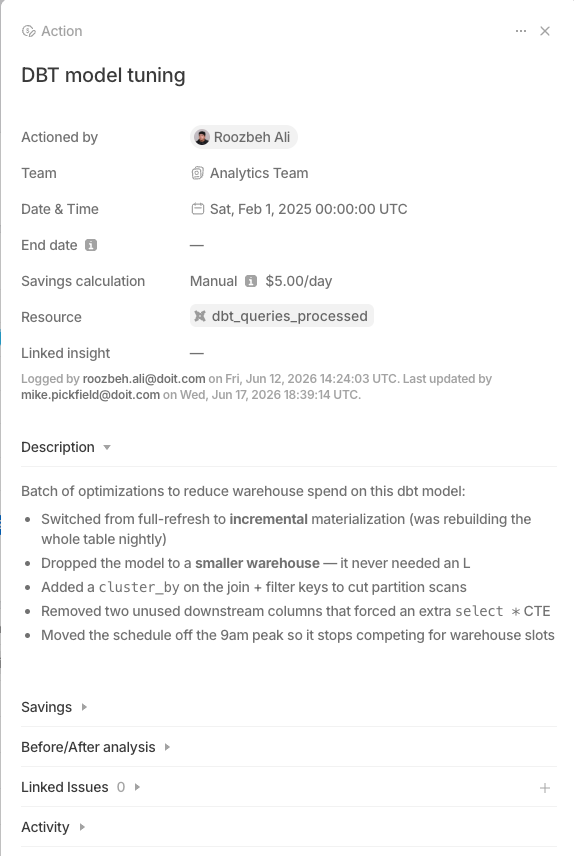
Action details
Click any action row to open the detail drawer on the right. The drawer shows the action's details, a breakdown of the savings calculation, any linked Jira issues (see Linking actions to Jira below), and an activity log of changes.
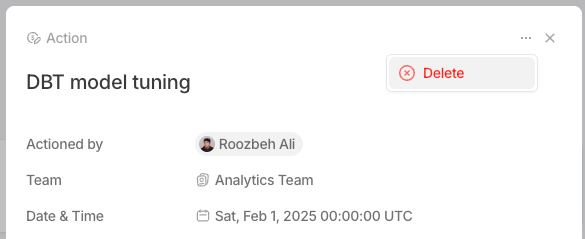
Editing & deleting actions
In the detail drawer, click any field to enter edit mode; changes save when you confirm. To delete, open the drawer menu (three dots) in the top-right and select Delete. A confirmation dialog appears — deletion can't be undone, and removes the action's savings from your aggregate numbers.
How savings are calculated
Automated savings
When you log a resource-scoped action with automated savings, SELECT compares the resource's average daily spend before the action to the average daily spend after. The difference is your daily savings.
- Before window: the 7 days before the action date.
- After window: the 7 days after the action date.
- The difference in average daily spend becomes the daily savings, expressed as a percentage of the before-period spend.
A few things to know about the method:
- The action day itself is excluded. Spend is day-level, so the action day holds partial/mixed before-and-after data that doesn't cleanly belong to either window.
- It needs about a week of post-action data. SELECT can't produce a result until the full 7-day after-window has elapsed — roughly 8 days after the action once nightly processing is included.
- It runs nightly. The calculation runs once per day, after SELECT pulls the latest spend from your account — so savings populate on the next daily refresh, not instantly.
- Minimum-spend floor. SELECT only trusts the comparison when there's at least $1/day of average spend in both windows. Below that, the automated rate defaults to 0% — too small to attribute reliably — and you can eyeball the impact from the before/after chart and switch to a manual figure if warranted.
- Multiple actions in the window. If more than one action was recorded for the resource within the comparison window, the breakdown includes a disclaimer, since their effects can't be cleanly separated.
⚠️ When to override. The before/after comparison assumes usage is roughly stable across the window, so it's sensitive to changes in usage patterns. If the actioned resource has seasonal or irregular usage, the automated number can misattribute normal variance to your change. When the chart looks distorted by usage swings rather than your change, switch to a manual percentage you can defend from the numbers you see.
Automated rates are also capped — generally 95%, and 50% for idle-time automations like smart suspend (which can only recapture idle time, not active query time). A computed rate above the cap usually signals a workload change rather than the action itself.
Manual savings
For manual savings you provide either a flat dollars-per-day amount or a percentage of the resource's spend. A flat amount annualizes simply as that amount × 365.
Realized vs. projected savings
The savings figures on the Savings tabs are calculated differently from the annualized numbers elsewhere in the app — and this is deliberate.
On the Savings tabs, SELECT materializes savings — it knows what each action has actually saved so far this year, day by day:
- Realized savings = the sum of actual daily savings from the start of the year up to today.
- Projected (annual) savings = realized-to-date plus a projection of the rest of the year, where the projection carries the average of the last 7 days of savings across the remaining days in the year.
Everywhere else in the app, annualized cost and savings use a simpler method: the average over whatever period you've scoped to, multiplied by 365. Scope the homepage to a single week and the annualized number treats that one week as representative of the whole year.
Why the difference? Elsewhere, SELECT is extrapolating from a slice of time. For actions, it isn't guessing — it has materialized exactly what each action saved up to now, so it only projects the remaining tail of the year. That makes the Savings tab's annual figure more grounded than a flat period × 365 extrapolation.
Logging actions from Insights
Insights are cost-optimization recommendations generated by SELECT. You can log an action directly from an insight to record that you've acted on the recommendation.
From the insight detail drawer, click Log Action.
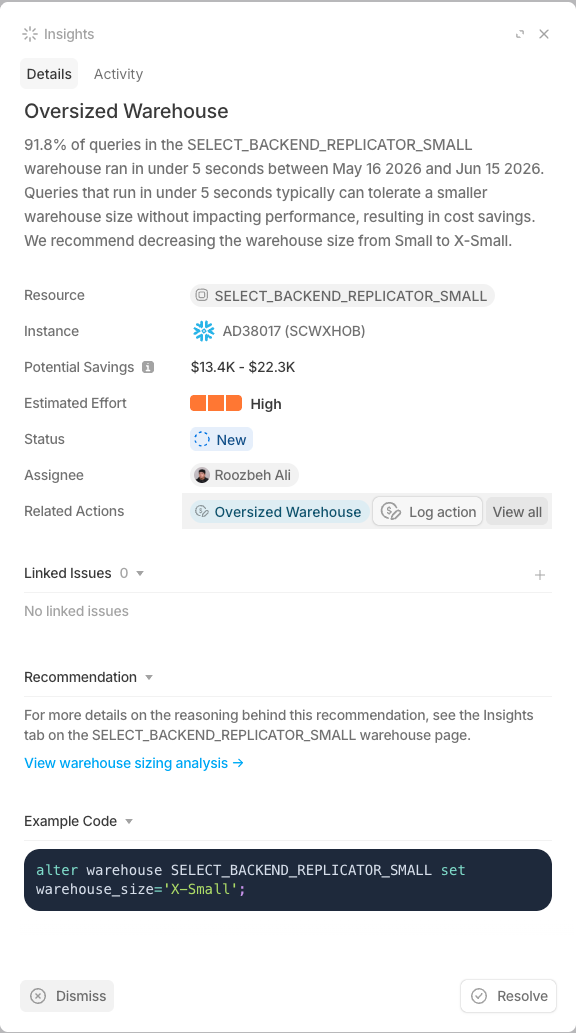
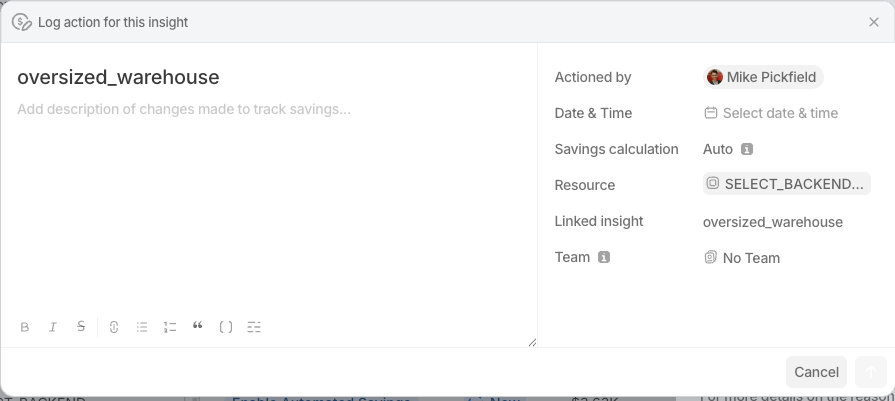
The Log Action modal opens with fields pre-filled from the insight:
- The resource is locked to the insight's resource.
- The title is pre-populated with the insight type.
After logging, the insight shows its related actions.
Linking actions to Jira
Because actions mirror issue-tracking workflows, you can link a (resource-scoped) action to a Jira ticket. Open the action's detail drawer and use the Linked Issues section, or use Link Jira issue in the action's menu. This keeps optimization work tracked in SELECT connected to the engineering work tracked in your issue tracker.