

SELECT makes it easy to spot and investigate unexpected cost spikes in your Snowflake account. The high level process is:
- Use the trend charts on the Home → Dashboard to identify dates with a spike in spend.
- Pinpoint which services, warehouses, users, or databases contributed to the spike.
- Use those details to filter down to specific workloads. For example, you can navigate to the Workloads page filtered by date range and warehouse to isolate the source of the spike.
Identify Spikes Using the Trend Charts
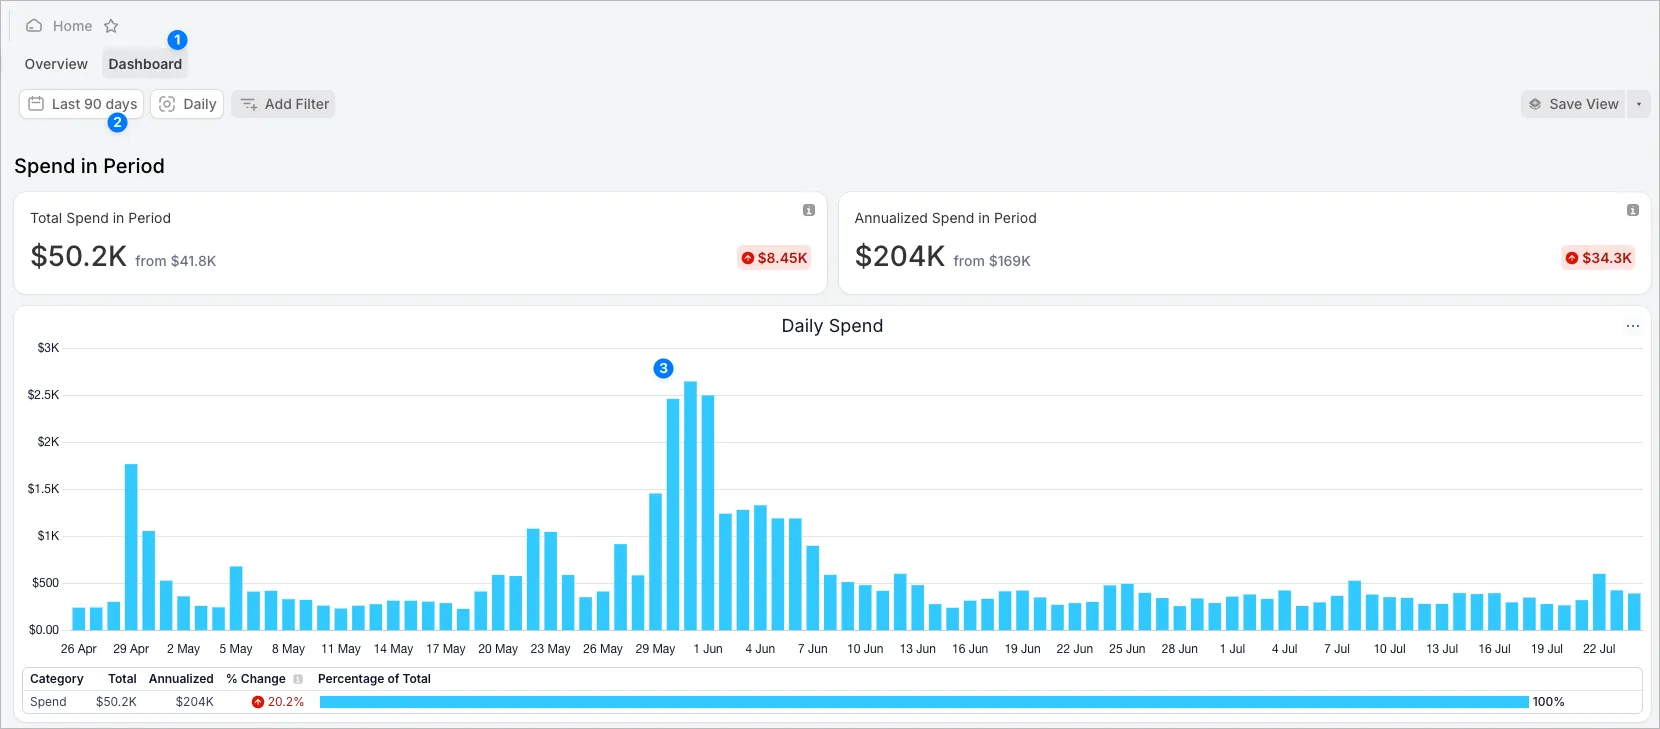
Navigate to Home → Dashboard (tab at the top of the screen). In this example, I’ll set the date filter to Last 90 Days to surface spikes across a longer timeframe. Here, there’s a clear cost spike from late May to early June:
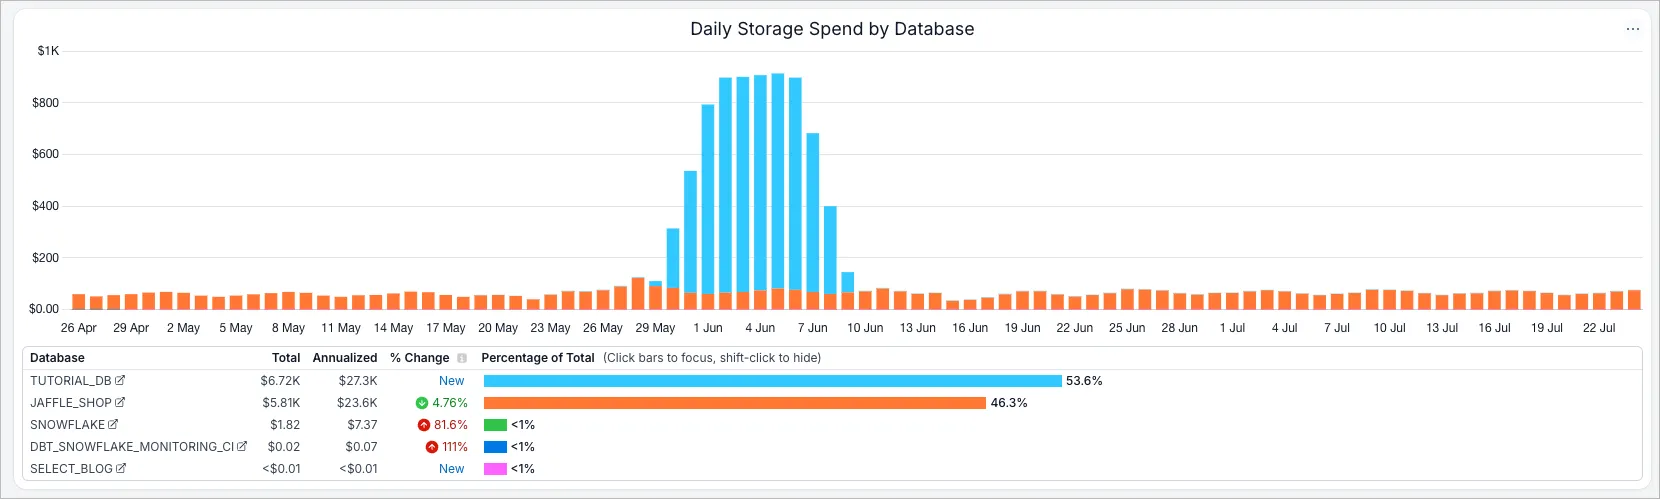
As I scroll down, I can see spend broken out by category. The first category is Snowflake Service, where it becomes immediately clear the spike is in Compute spend. Interestingly, once compute spend returned to normal, there was a noticeable spike in Storage spend a few days later.
Continuing down the page, we see the spike was entirely driven by the SYSTEM user. That suggests the cause could be a task or dynamic table, but let’s keep exploring.
We can see from the final chart that TUTORIAL_DB was responsible for the Storage spike.
Now, let’s find out what happened.
Drill Down to Resources with the Spike
Let’s figure out what caused the spike in Compute cost. First, filter to the date range where the spike occurred. Then, click the warehouse name in the Warehouse bar chart to jump to the Workloads page filtered by that warehouse and date range.
From there, it quickly becomes clear that a Task called WEEKLY_REFRESH_DEMO_ORDERS was responsible for about 90% of the spend on those days.
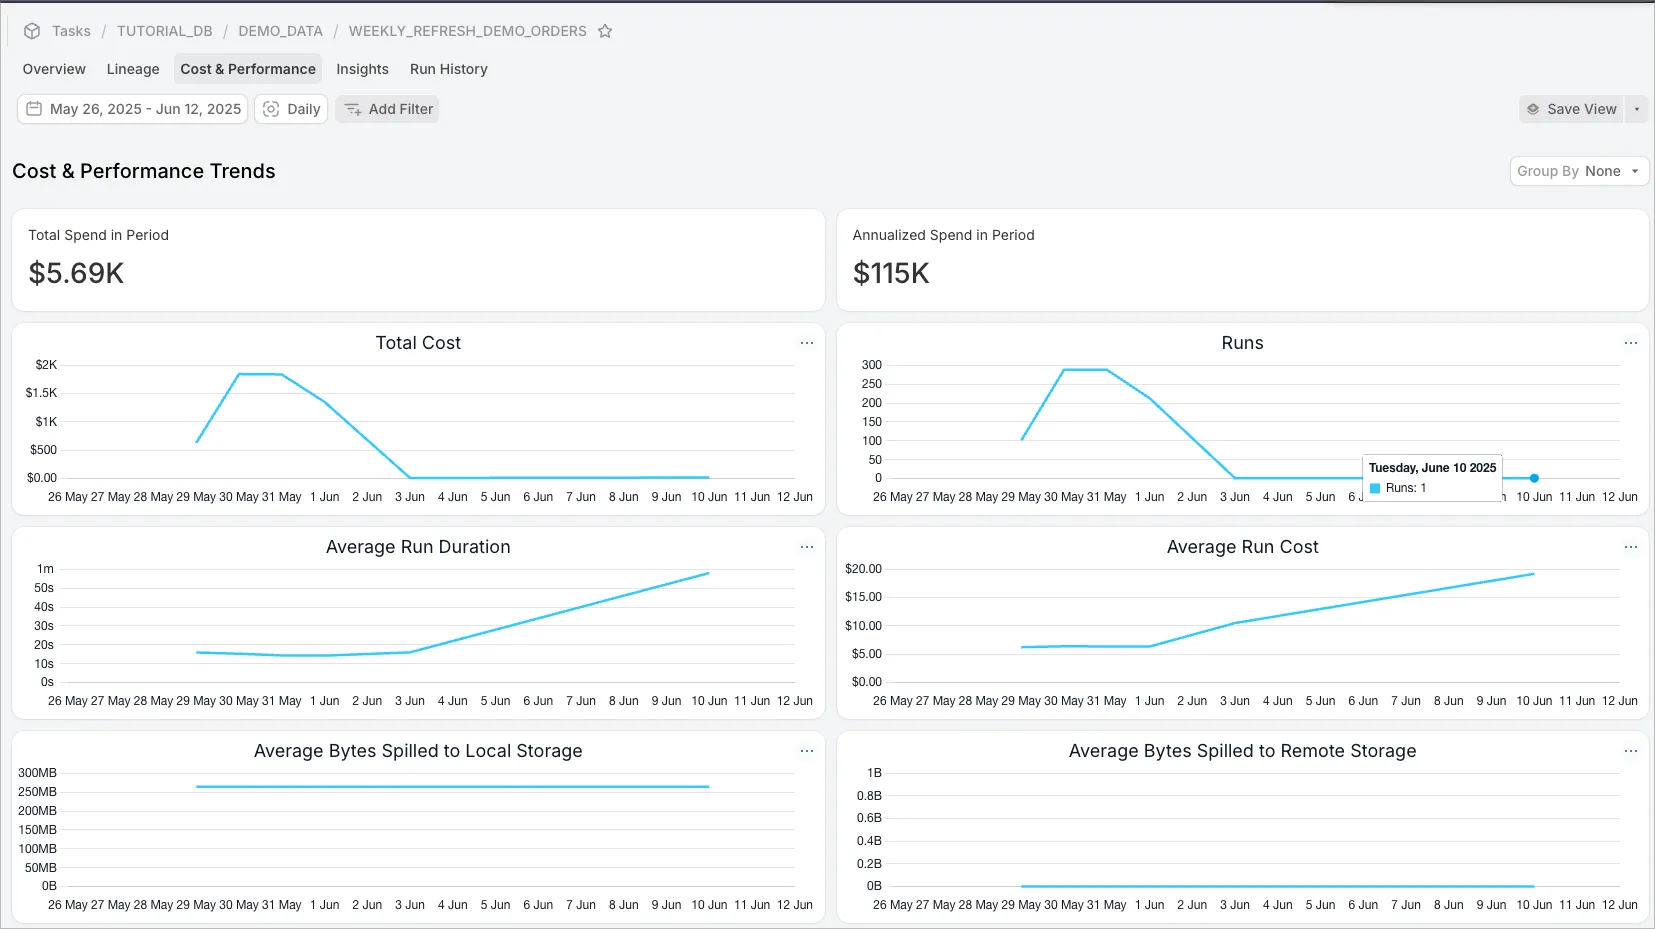
Click the workload name in the table, then go to the Cost & Performance tab. Here, you’ll see the task was running about 300 times per day for a few days, then dropped to once per day. That explains the spike!
Generalizing the Approach
You can take the same approach from any of the “Resources” pages in SELECT: Workloads, Query History, Warehouses, or Storage. You can also follow this process from the Explorer page. The steps are:
- Identify the spike on a trend chart.
- Filter to the spike.
- Drill into the detailed pages by clicking the left column.
- Analyze the Cost & Performance tab, Lineage, and Insights.

