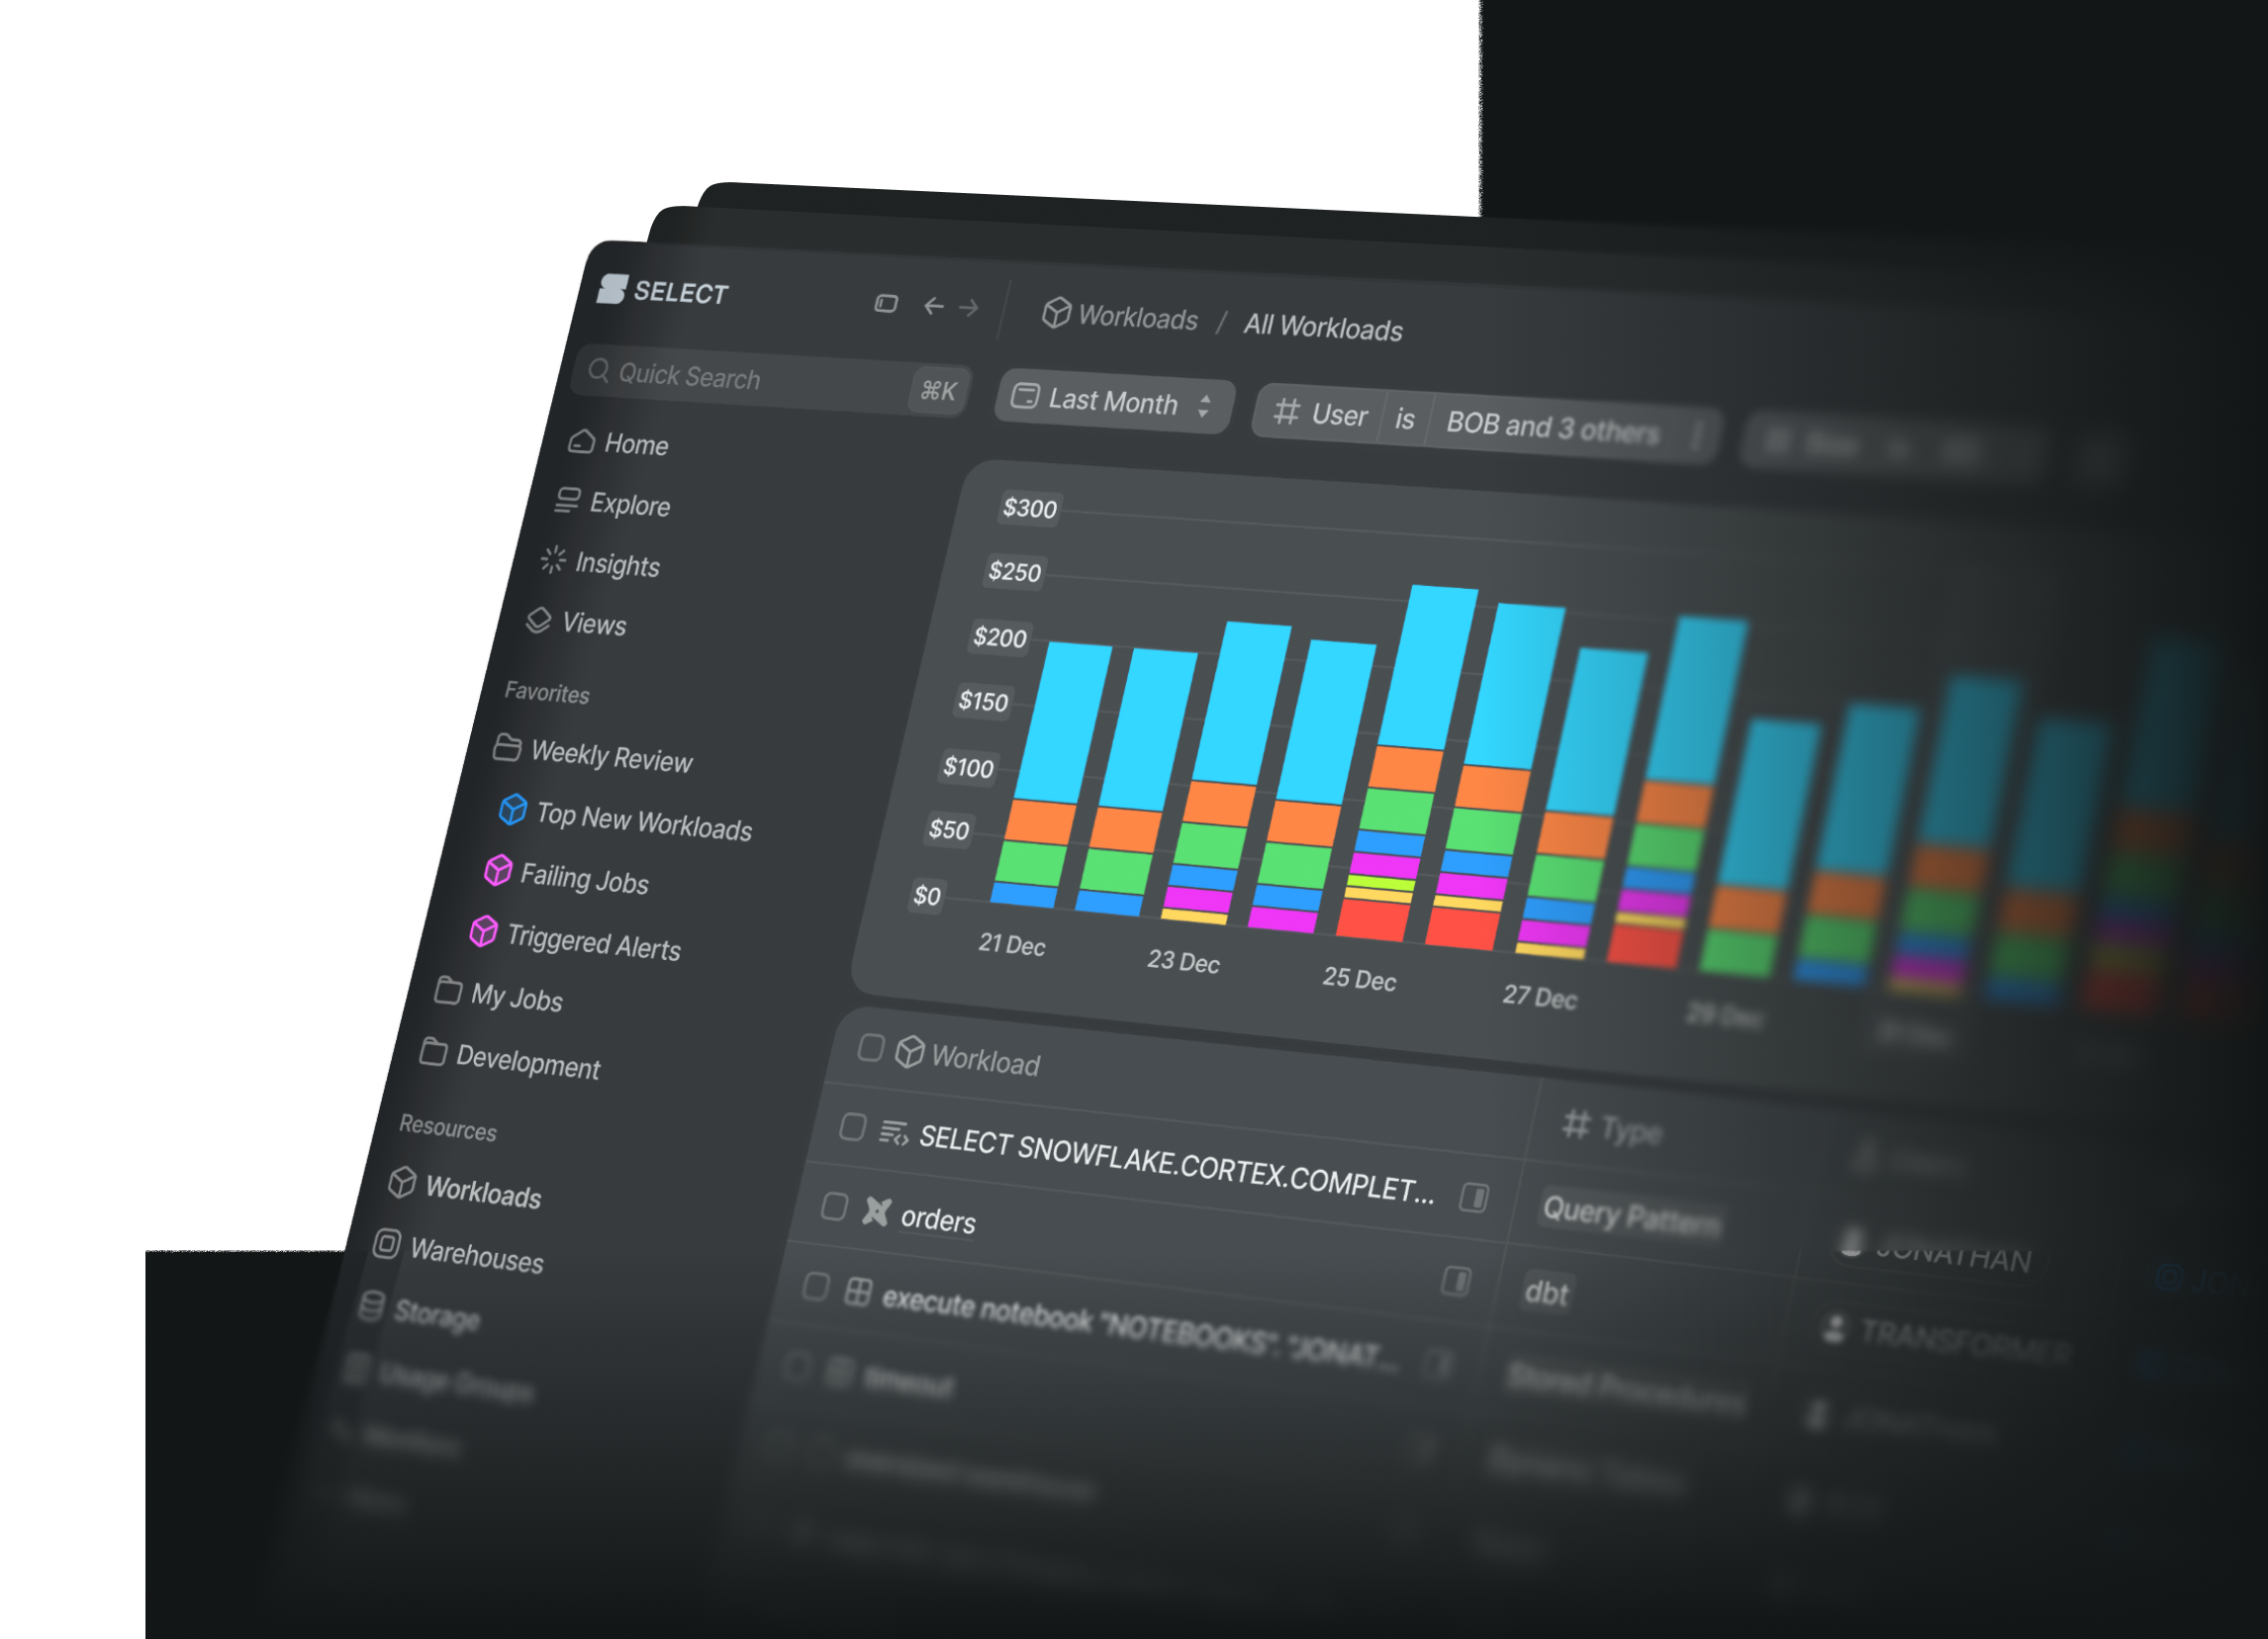
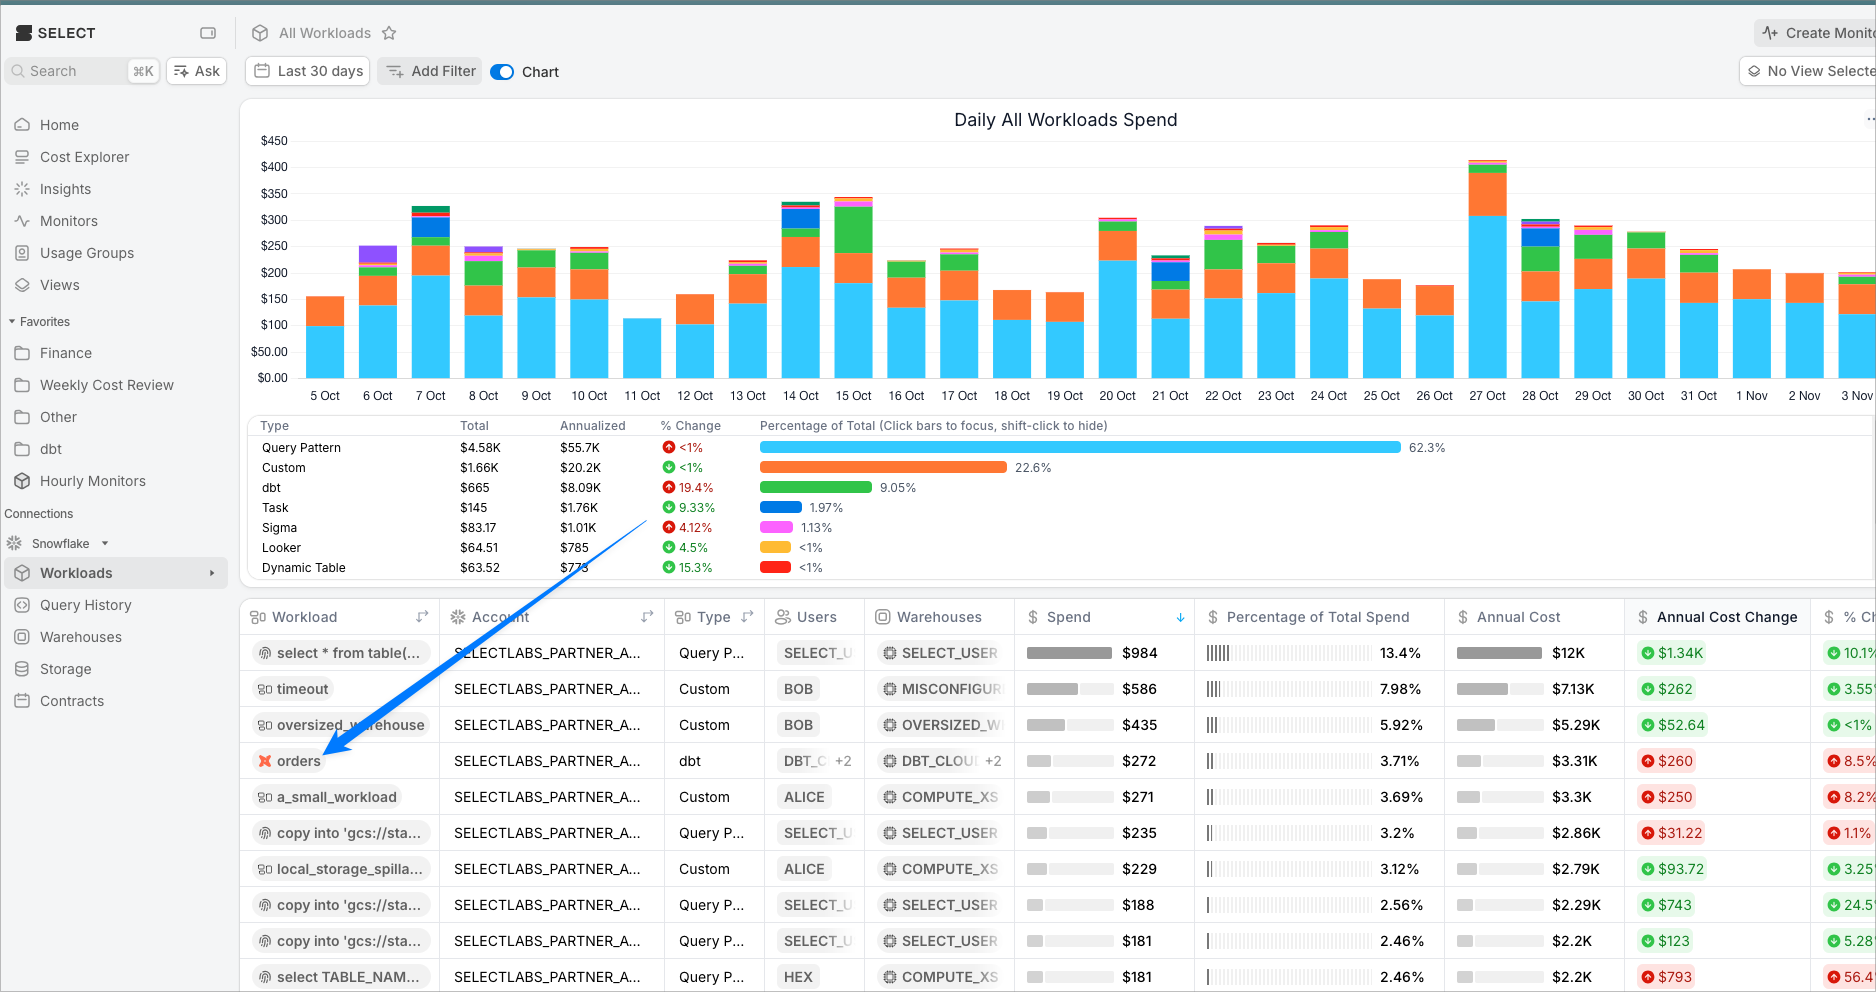
From Workloads page
From the Workloads page, click any workload name to drill into that workload. (bottom table, left column).
On the next page, click "view latest run" in the right sidebar.
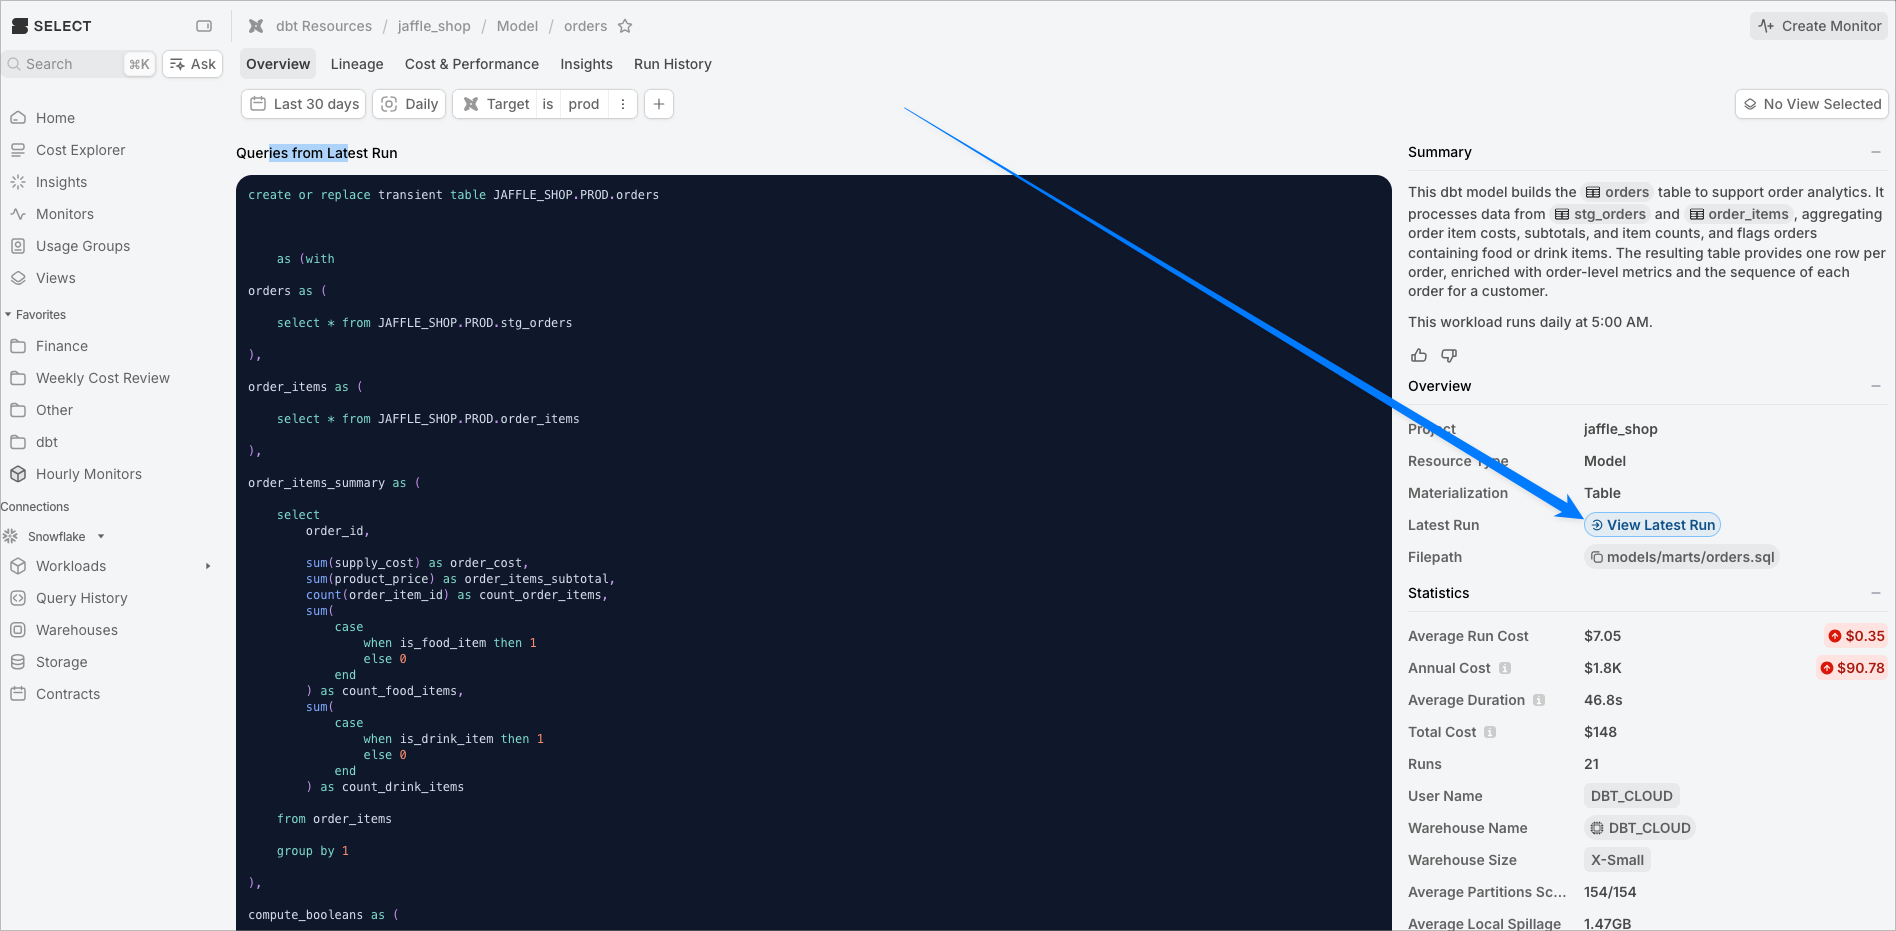
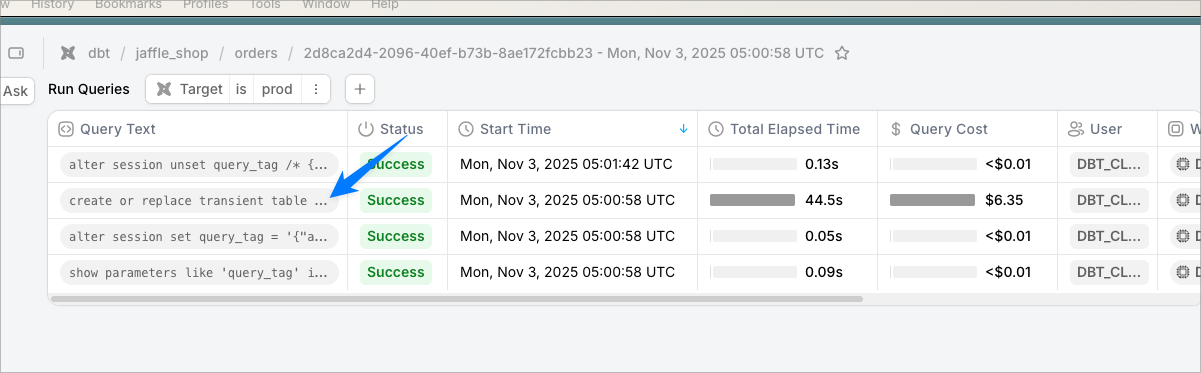
On the this page, click one of the queries you want to study:
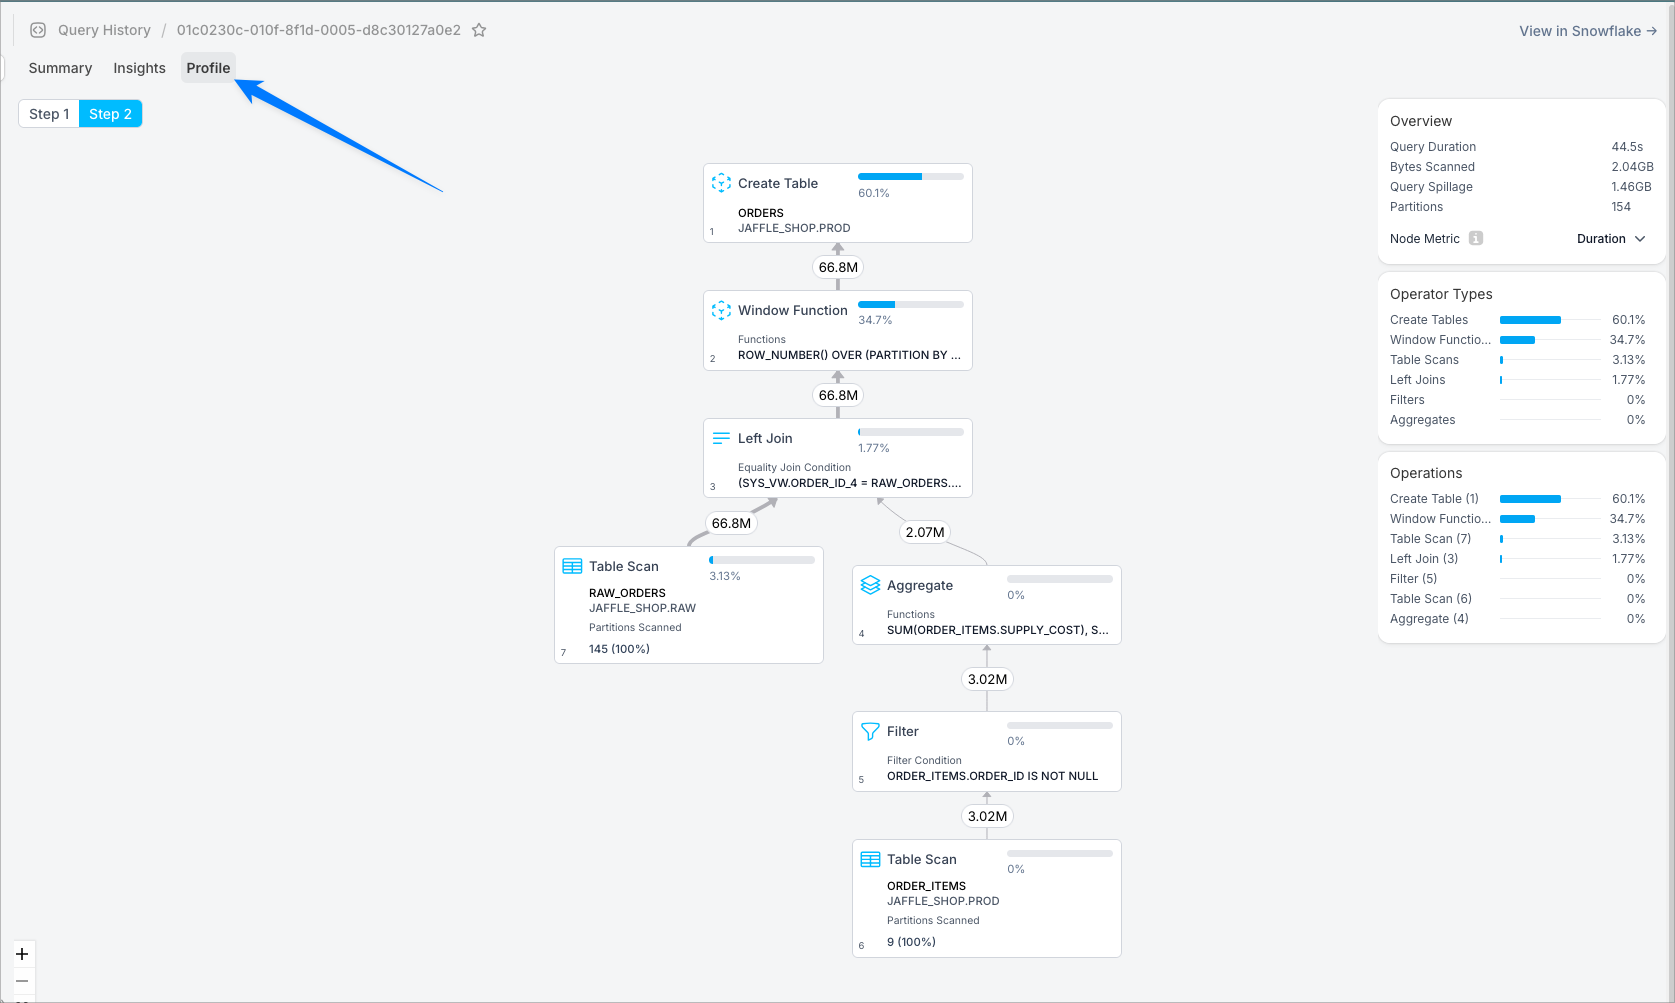
On the next page that loads up, click the Profile tab at the top:
From the Query History page
Navigate to query history in the left sidebar. Click any Query Text to drill in, then click the same Profile tab shown in the screenshot above.