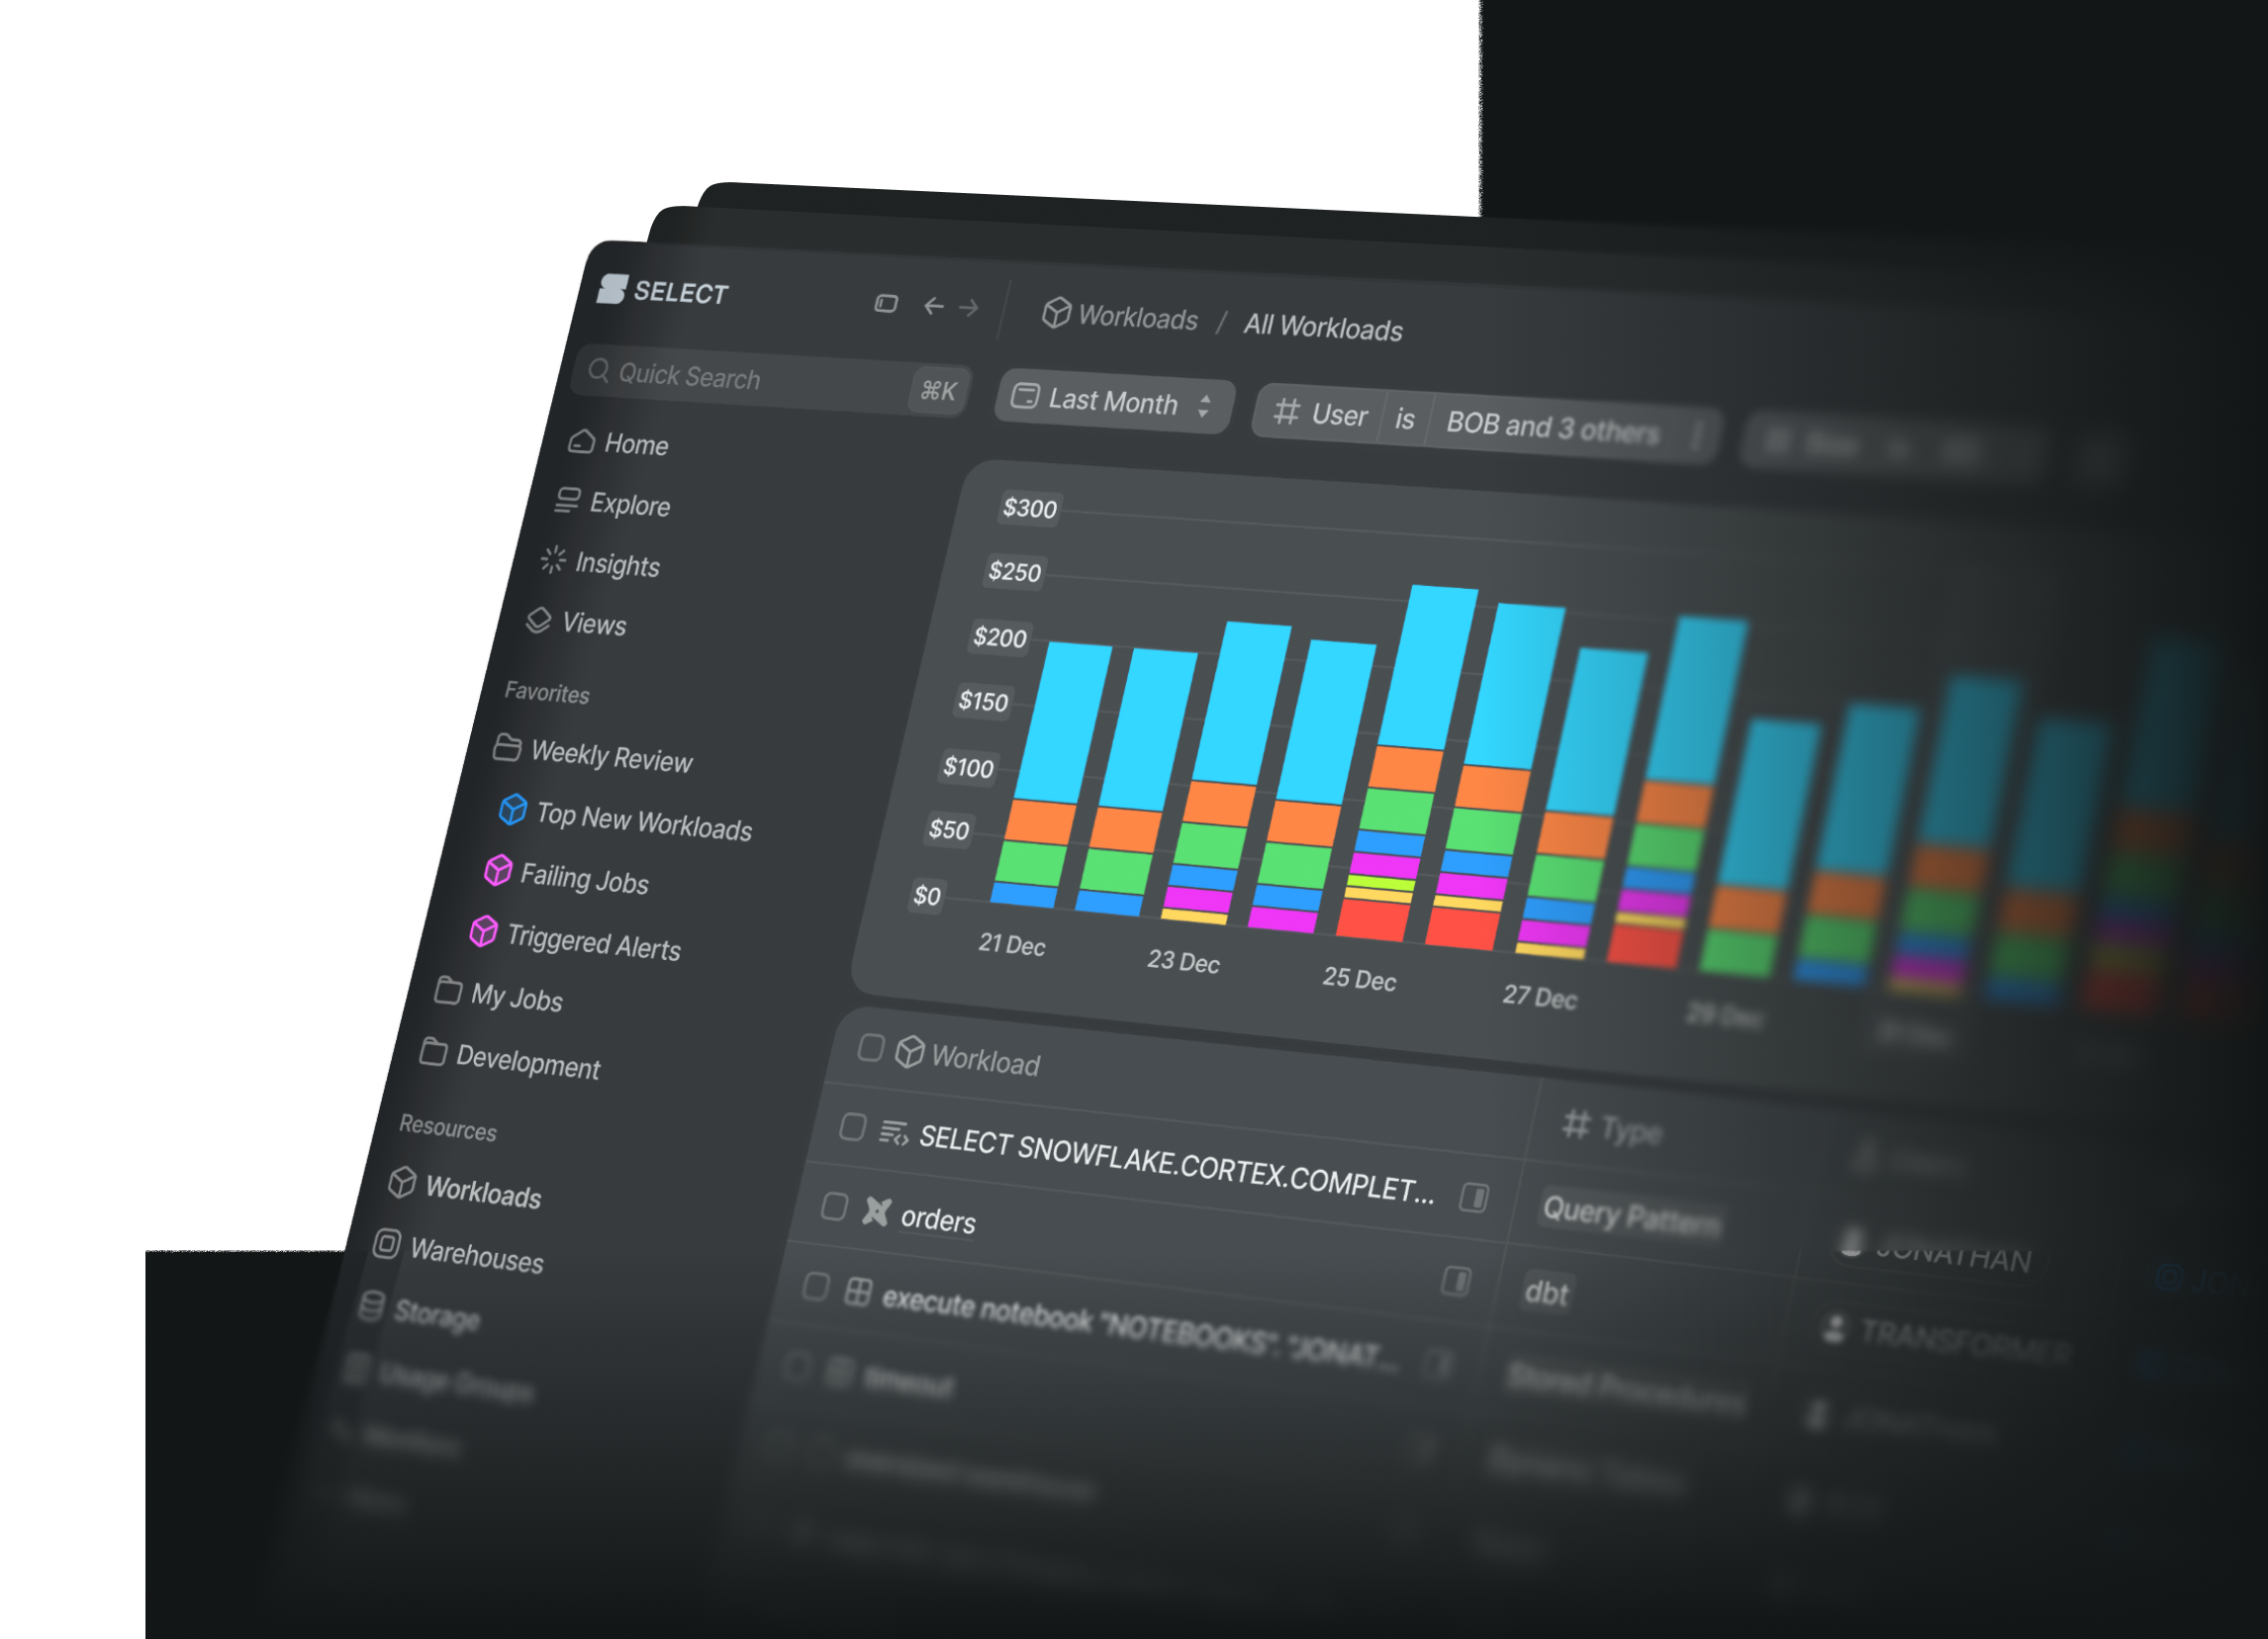
SELECT gives you full visibility into Snowflake AI and Cortex costs — from a single "how much are we spending on AI" figure down to the individual model, user, and query driving it. This guide covers what SELECT tracks and the tools for analyzing it.
What SELECT tracks
SELECT groups every Snowflake AI feature under a single AI Services category, broken down by resource type:
- Cortex Functions — LLM inference and embedding calls (e.g. Complete, Embed)
- Cortex Search — text embedding and search indexing
- Cortex Search Serving — serving search queries from Cortex Search indexes
- Cortex Analyst — AI-powered SQL generation, attributed by user
- Cortex Agent — agentic workflows
- Cortex Code — AI code assistance (Snowsight and CLI), attributed by user
- Cortex Fine Tuning — custom model training
- Cortex Provisioned Throughput — reserved model capacity
- Document AI — document processing
- Snowflake Intelligence — native Snowflake intelligence features
For the LLM-based services — Cortex Functions, Agent, Code, and Snowflake Intelligence — SELECT also attributes spend and tokens to the specific model used, even when a single request invokes more than one model.
Start with the Snowflake AI Usage dashboard
The fastest way to get oriented is to create a dashboard from the built-in Snowflake AI Usage template. It comes preconfigured with:
- Total Spend and Total Spend (Annualized)
- Daily Spend by Resource Type — which Cortex service the spend comes from
- Daily Spend by AI Model — which models cost the most
- Daily Spend by User
- Top AI Workloads
This gives you the full picture in one place before you drill into any single dimension.
Explore AI spend in Cost Explorer
Navigate to Cost Explorer and group by Service — AI-related costs appear as a distinct AI Services category, so you can see what share of your Snowflake bill is AI. Filter to AI Services to isolate it, then break it down further by grouping by:
- Resource Type — costs per Cortex service (Cortex Functions, Search, Agent, Document AI, etc.)
- AI Model — costs per model, so you can compare, say, Claude vs. Llama vs. Mistral spend across your account
Tracking a specific service — e.g. Cortex Code: apply the filters Service = 'AI Services' and Resource Type = 'Cortex Code' (open in Cost Explorer). Each Resource row is a user in your account incurring Cortex Code costs. Note that Cortex Code was free to use until April 1st 2026.
Analyze at the workload and query level
On Workloads → All Workloads and other query-based pages, use + Add Column to bring in AI-specific columns:
- Cortex Function Spend — total spend from Cortex Function calls
- Cortex Tokens — total tokens consumed
- Cortex Function Credits — credits consumed by Cortex Functions
- Document AI Spend — spend from Document AI processing
- Document AI Credits — credits consumed by Document AI
- AI Model — the model(s) each workload or query used
From here you can:
- Sort by Cortex Function Spend (descending) to find your highest-spending workloads, and filter Cortex Function Spend is not null to show only workloads with AI spend.
- Group by User (three-dot menu on the chart, or add User as a column) to see which people drive the most AI spend.
- Group by AI Model to compare model usage across workloads.
- Save any of these as a Saved View for ongoing monitoring.
Set up spend alerts
From Cost Explorer, filter to the AI Services service type, then click Create Monitor to set up a Spend Monitor. Configure your threshold and notification preferences, and SELECT will alert you proactively if AI spend spikes unexpectedly.