Top Gradient

How do I display Snowflake spend by User?

On the All Workloads page, you can use the 3 dots in the chart and group by user. (Use the search and type ‘user’).
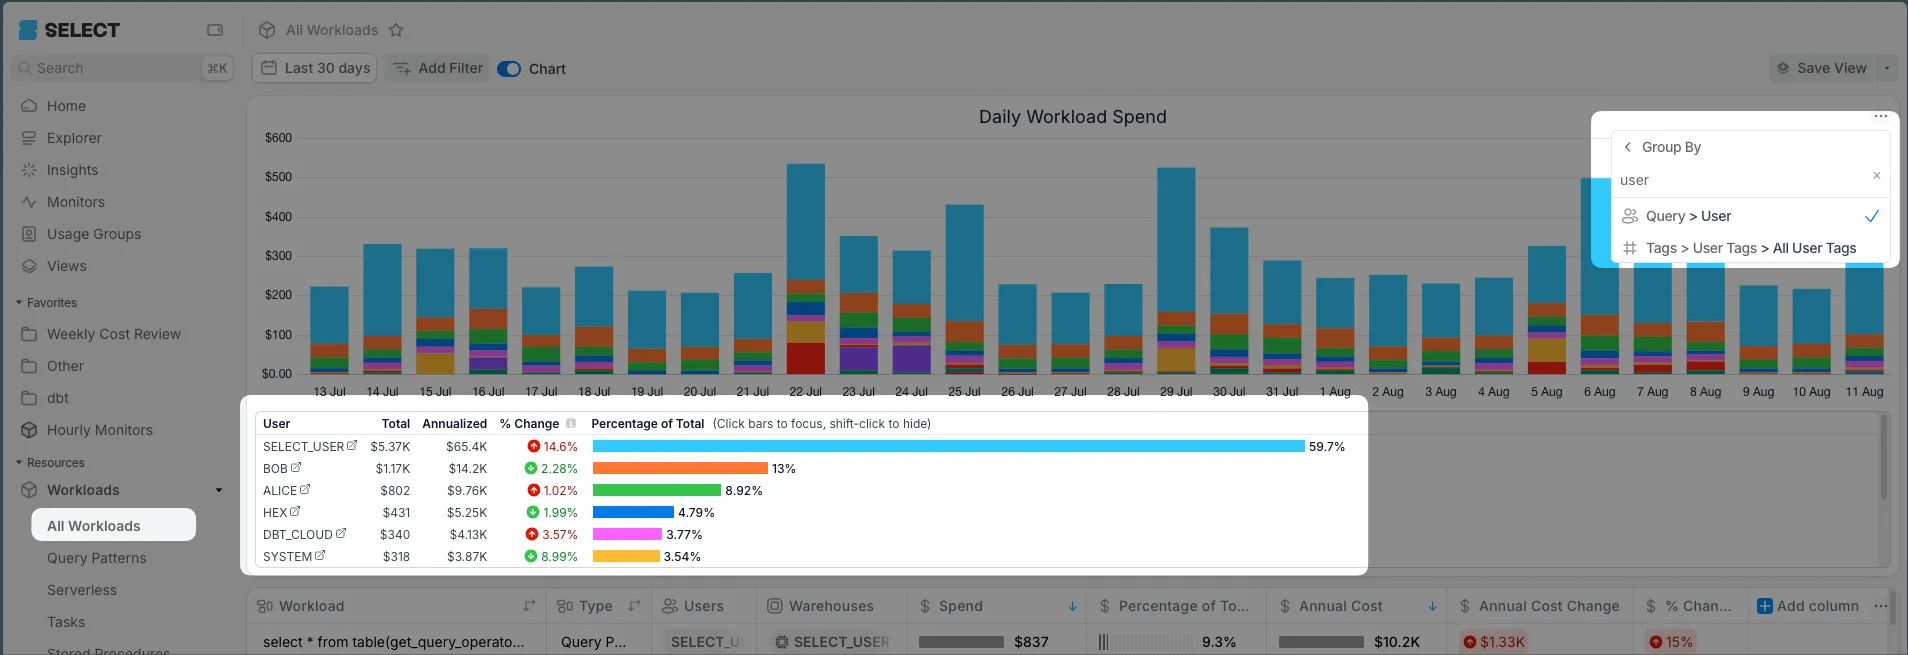
All Workloads chart three-dot menu with "Group By" set to user

Also, in the table, you can remove columns by clicking a column header and click Hide. Then add ‘user’ to the Group By using the blue + Add Column on the right.

Here’s an example at the Workload + User grain.
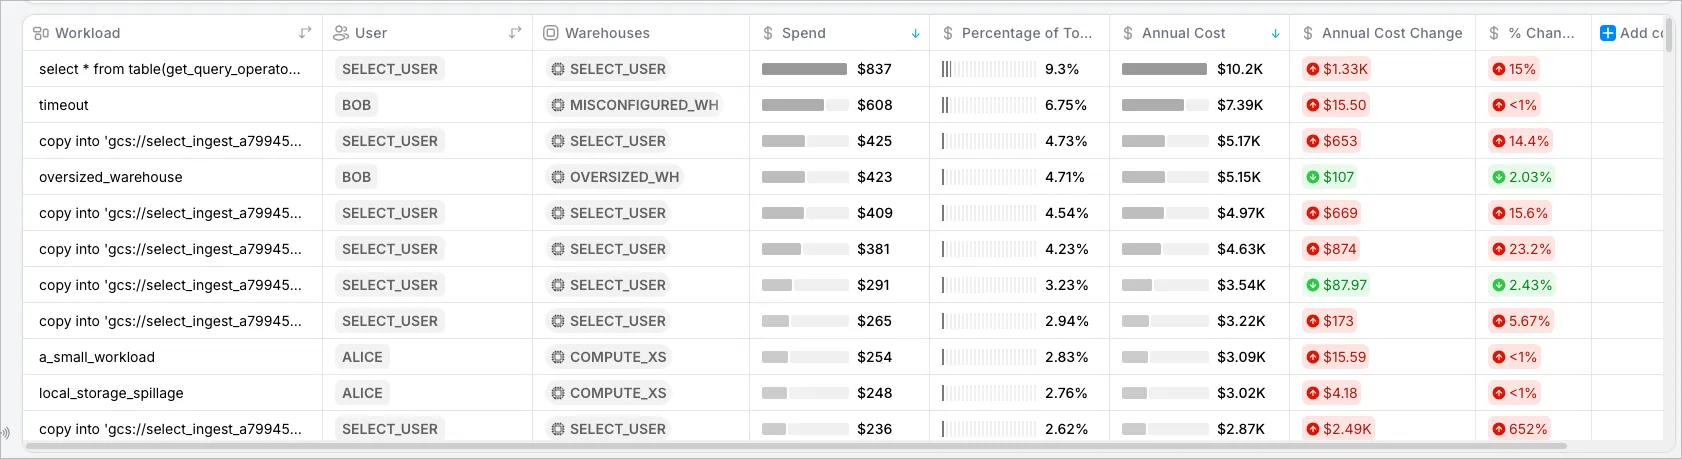
Workloads table grouped by Workload and User, showing spend at that grain

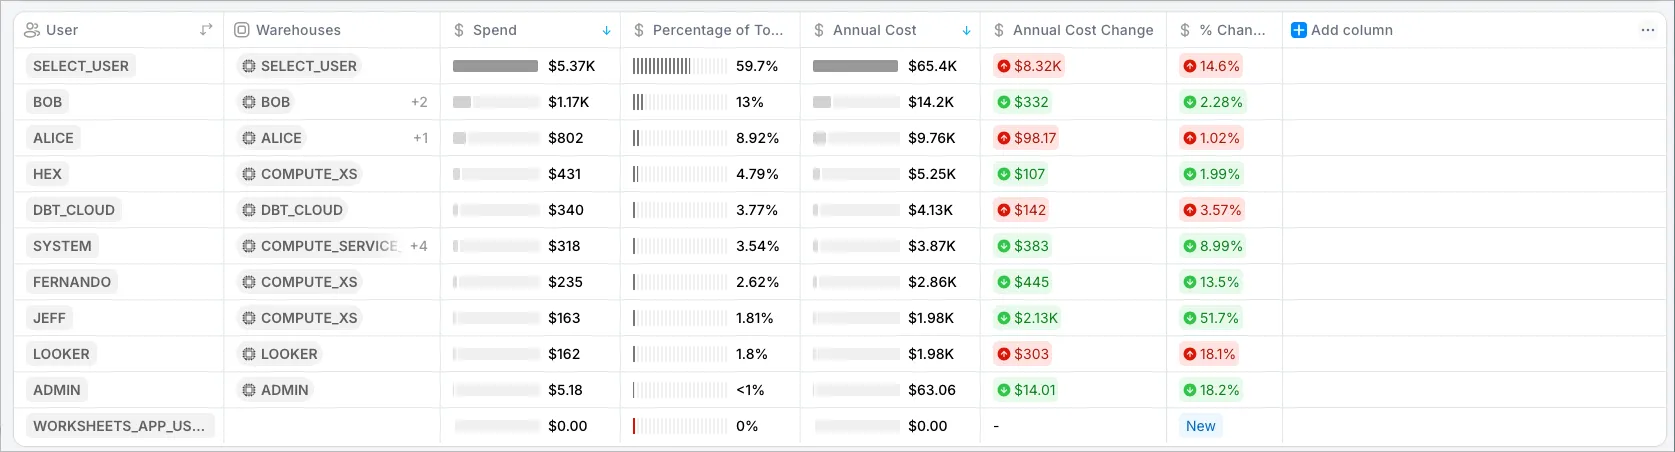
Here’s an example at the User grain.
Workloads table grouped by User only, showing spend per user

Get up and running in less than 15 minutes

Connect your Snowflake, Databricks, or BigQuery account and instantly understand your savings potential.

CTA Screen