Monitors
Overview
Staying on top of your Snowflake environment is challenging. With thousands of active users, new workloads being added each day, and complex data pipelines, it’s difficult for platform teams to stay on top of everything going on in their account.
SELECT’s Monitors feature helps Snowflake users get timely notifications about critical events in their account.
Monitor Types
SELECT currently supports two types of monitors:
Digest Monitor
Digest Monitors run on a fixed schedule and send a message to your configured destinations. Use Digest Monitors to send schedule Snowflake usage reports, receive a list of top new workloads, and more.
Threshold Monitor
Threshold Monitors can be used to notify you if a metric exceeds a specific threshold in a given time period. Use Threshold Monitors to get notified of spend spikes, performance regressions, and more.
Anomaly Monitor
Anomaly Monitors leverage machine learning to automatically determine whether a metric is anomalous (abnormally high or low), taking into account seasonal patterns, and notify you accordingly. Compared to Threshold Monitors, the advantage of Anomaly Monitors is you don’t need to manually set or maintain the threshold value at which you will get alerted. You can, however, optionally adjust the sensitivity of the algorithm to balance between rapid detection and minimizing false positives.
Future Monitor Types
In 2025, we will add support for the following monitor types:
- Budget Monitors will allow you to get notified if the spend from a specific set of Snowflake resources is (a) forecasted to exceed a budget value in in a given time period or (b) has exceeded the budget value. Budget Monitors are helpful for scenarios where you want teams or groups of users to stay under a specified amount of spend in a given month, quarter or year.
Example Monitors
Daily Account Spend Digest
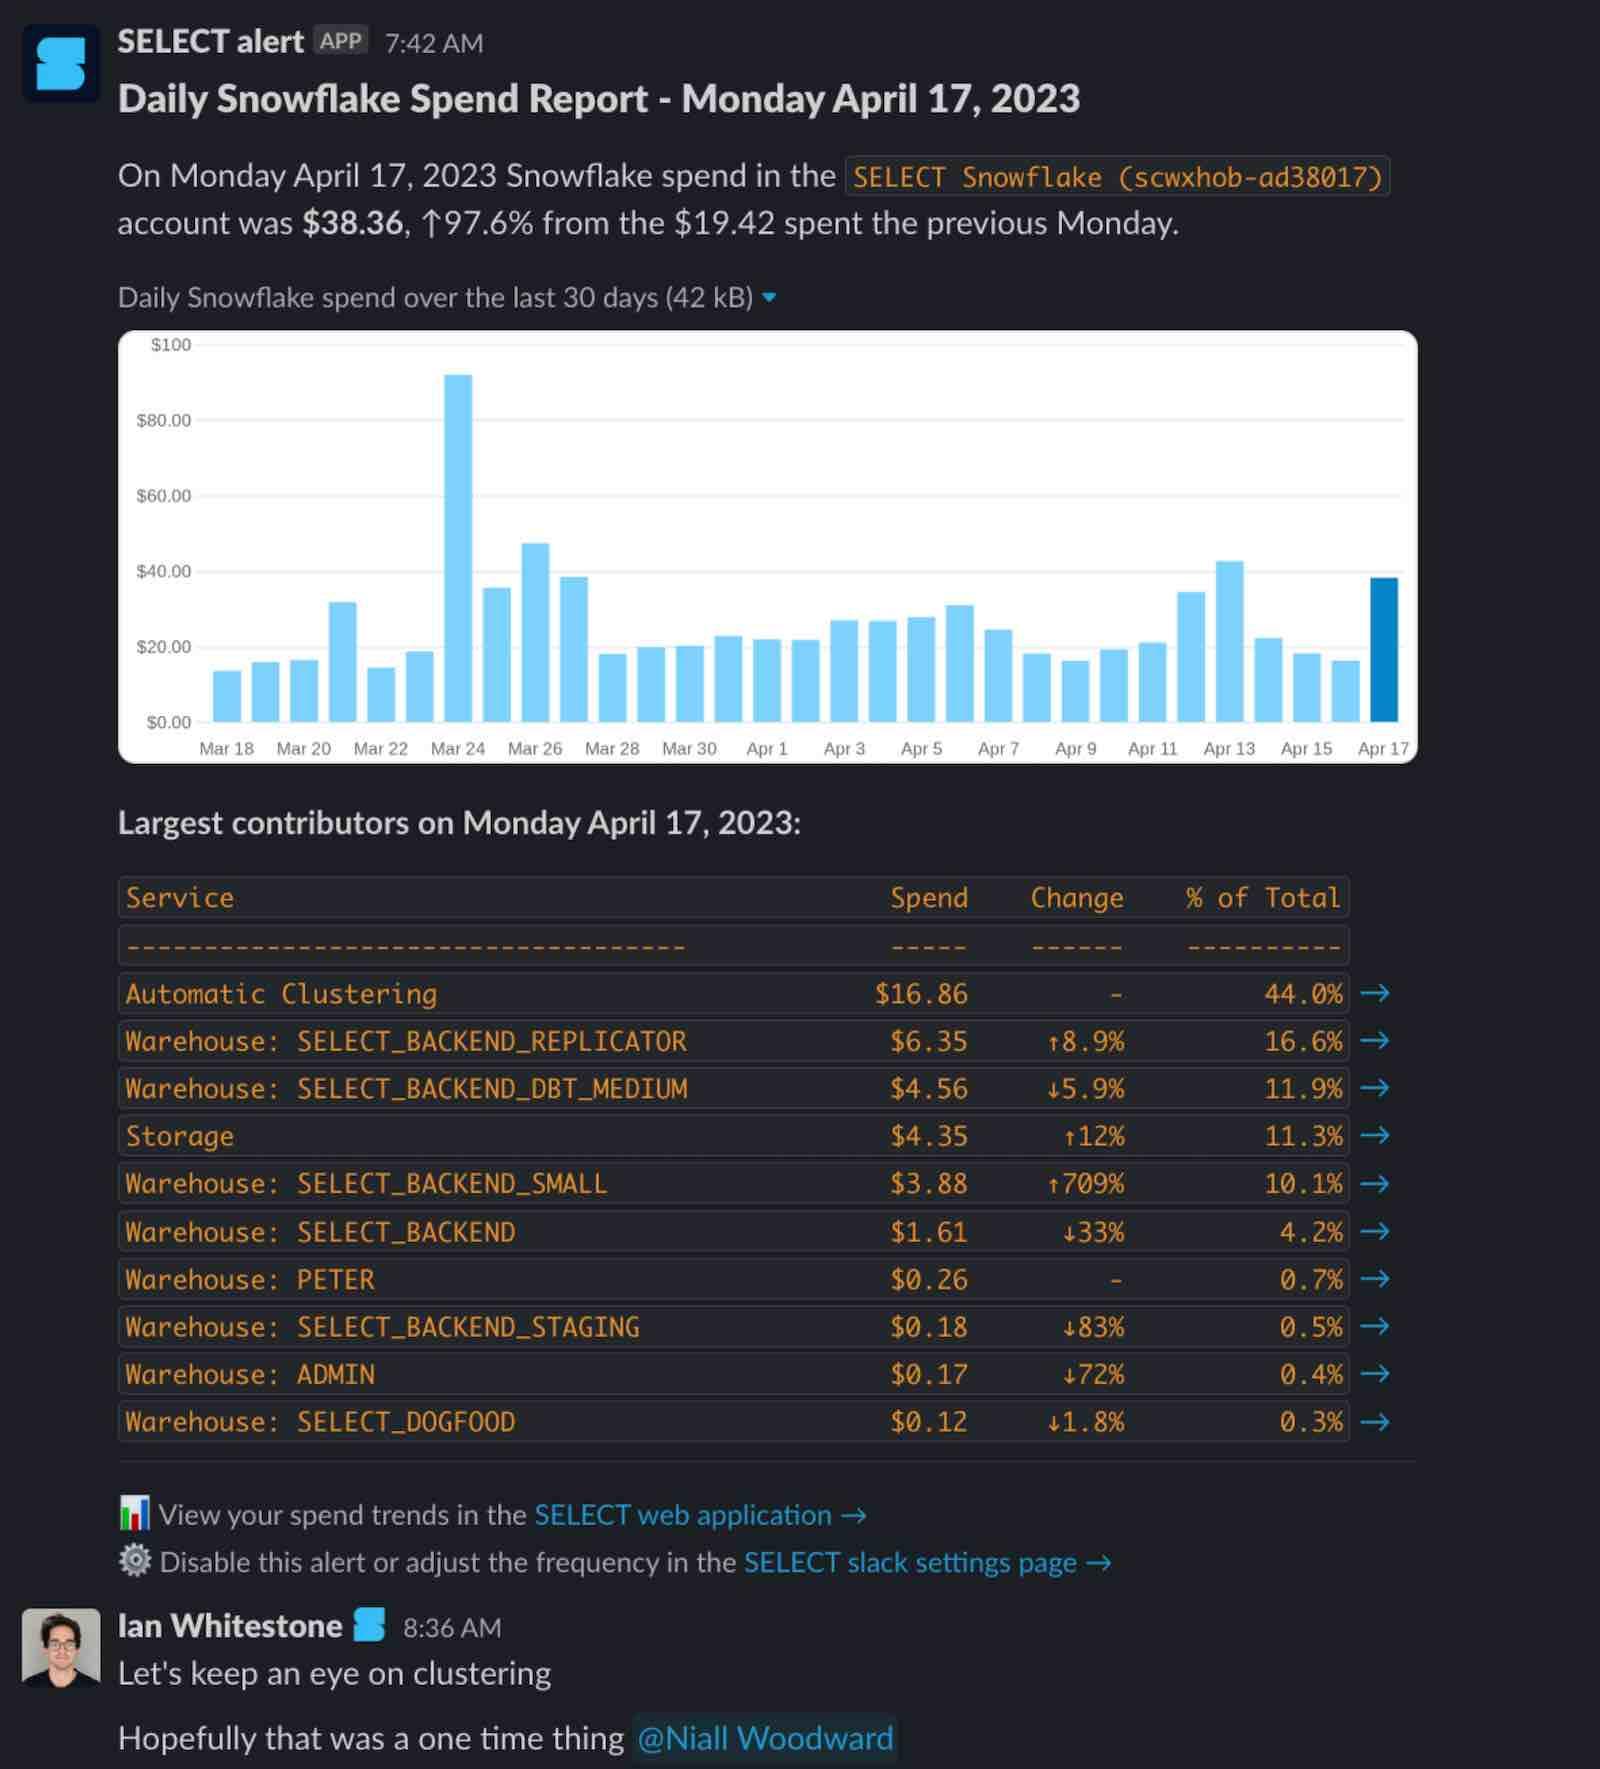
Here's an example of a Daily Spend Digest from our Snowflake account:

On this day, we had a large usage spike that was driven by Automatic Clustering being enabled for the first time. We were able to diagnose exactly what happened straight from the message, but you can also click into the relevant section of the SELECT web app (i.e. the warehouse page) to quickly understand what drove the increase.
Usage Group Spend Digest
Here's an example Weekly Spend Digest configured for a Usage Group:
Account Spend Threshold Monitor
Here's an example Slack alert for a Spend Threshold Monitor for a Snowflake account. You can also enable Threshold Monitors for other Snowflake resources like virtual warehouses.
Usage Group Spend Threshold Monitor
Here's an example of a Spend Threshold Monitor for all dbt models, achieved by creating a new Usage Group for dbt spend specifically.