

Databricks Job Workloads, Compute & Custom Rates
Friday, March 27, 2026
 Dhruv MittalProduct Engineer
 Mustafa PetiwalaProduct Engineer @ SELECT
 Jeff RezazadaProduct Engineer @ SELECT
Get full visibility into your Databricks Job workloads, compute spend, and configure custom discounted rates.
Adding to our existing support for Query History and Query Pattern Workloads, we've added support for job workloads, SQL Warehouse, and All Purpose Compute spend. Plus, custom rate sheets ensure your spend reflects your actual negotiated pricing.
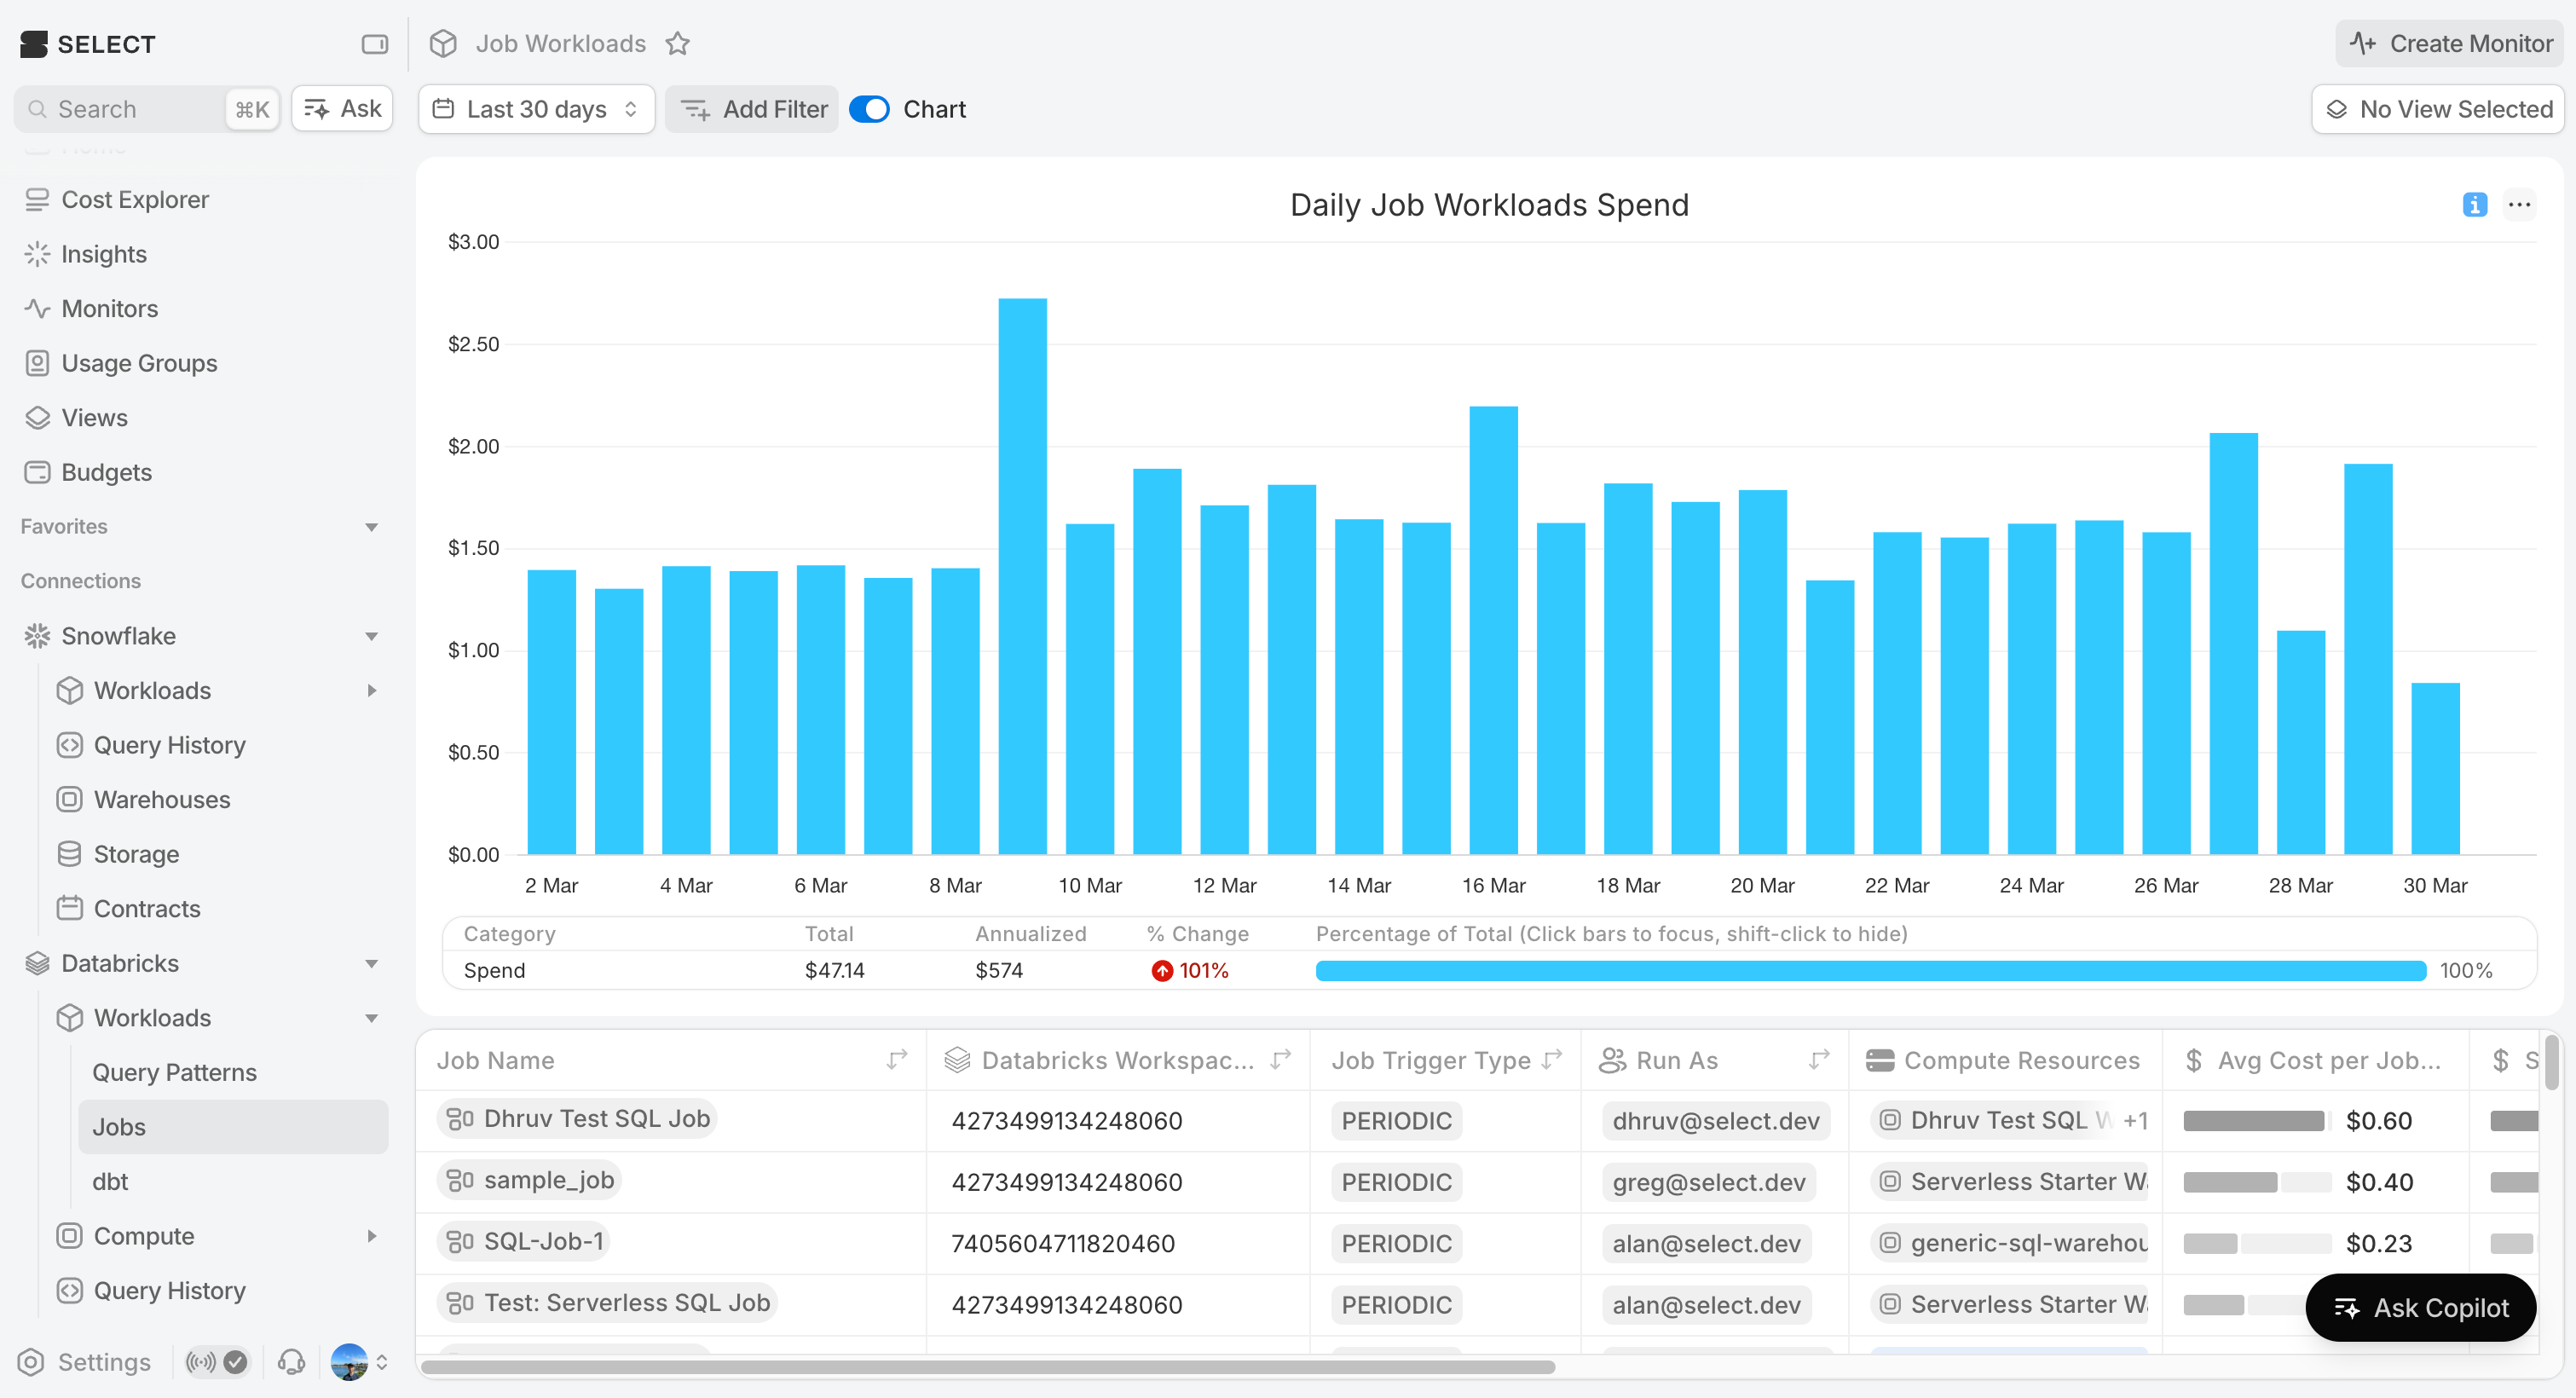
Jobs Workloads
Navigate to the job workloads page to see a cost breakdown for all your jobs. Group by job name, run as user, compute, or any other attribute available. Drill into any job for task-level cost breakdowns, jobs compute cost and performance, optimization insights, and a full run history.
Compute Spend
Use the Compute pages for SQL Warehouses and All Purpose Compute clusters to get a cost overview for all your compute. Click into the warehouse or compute cluster for more details including cost trends, performance metrics, insights and more.
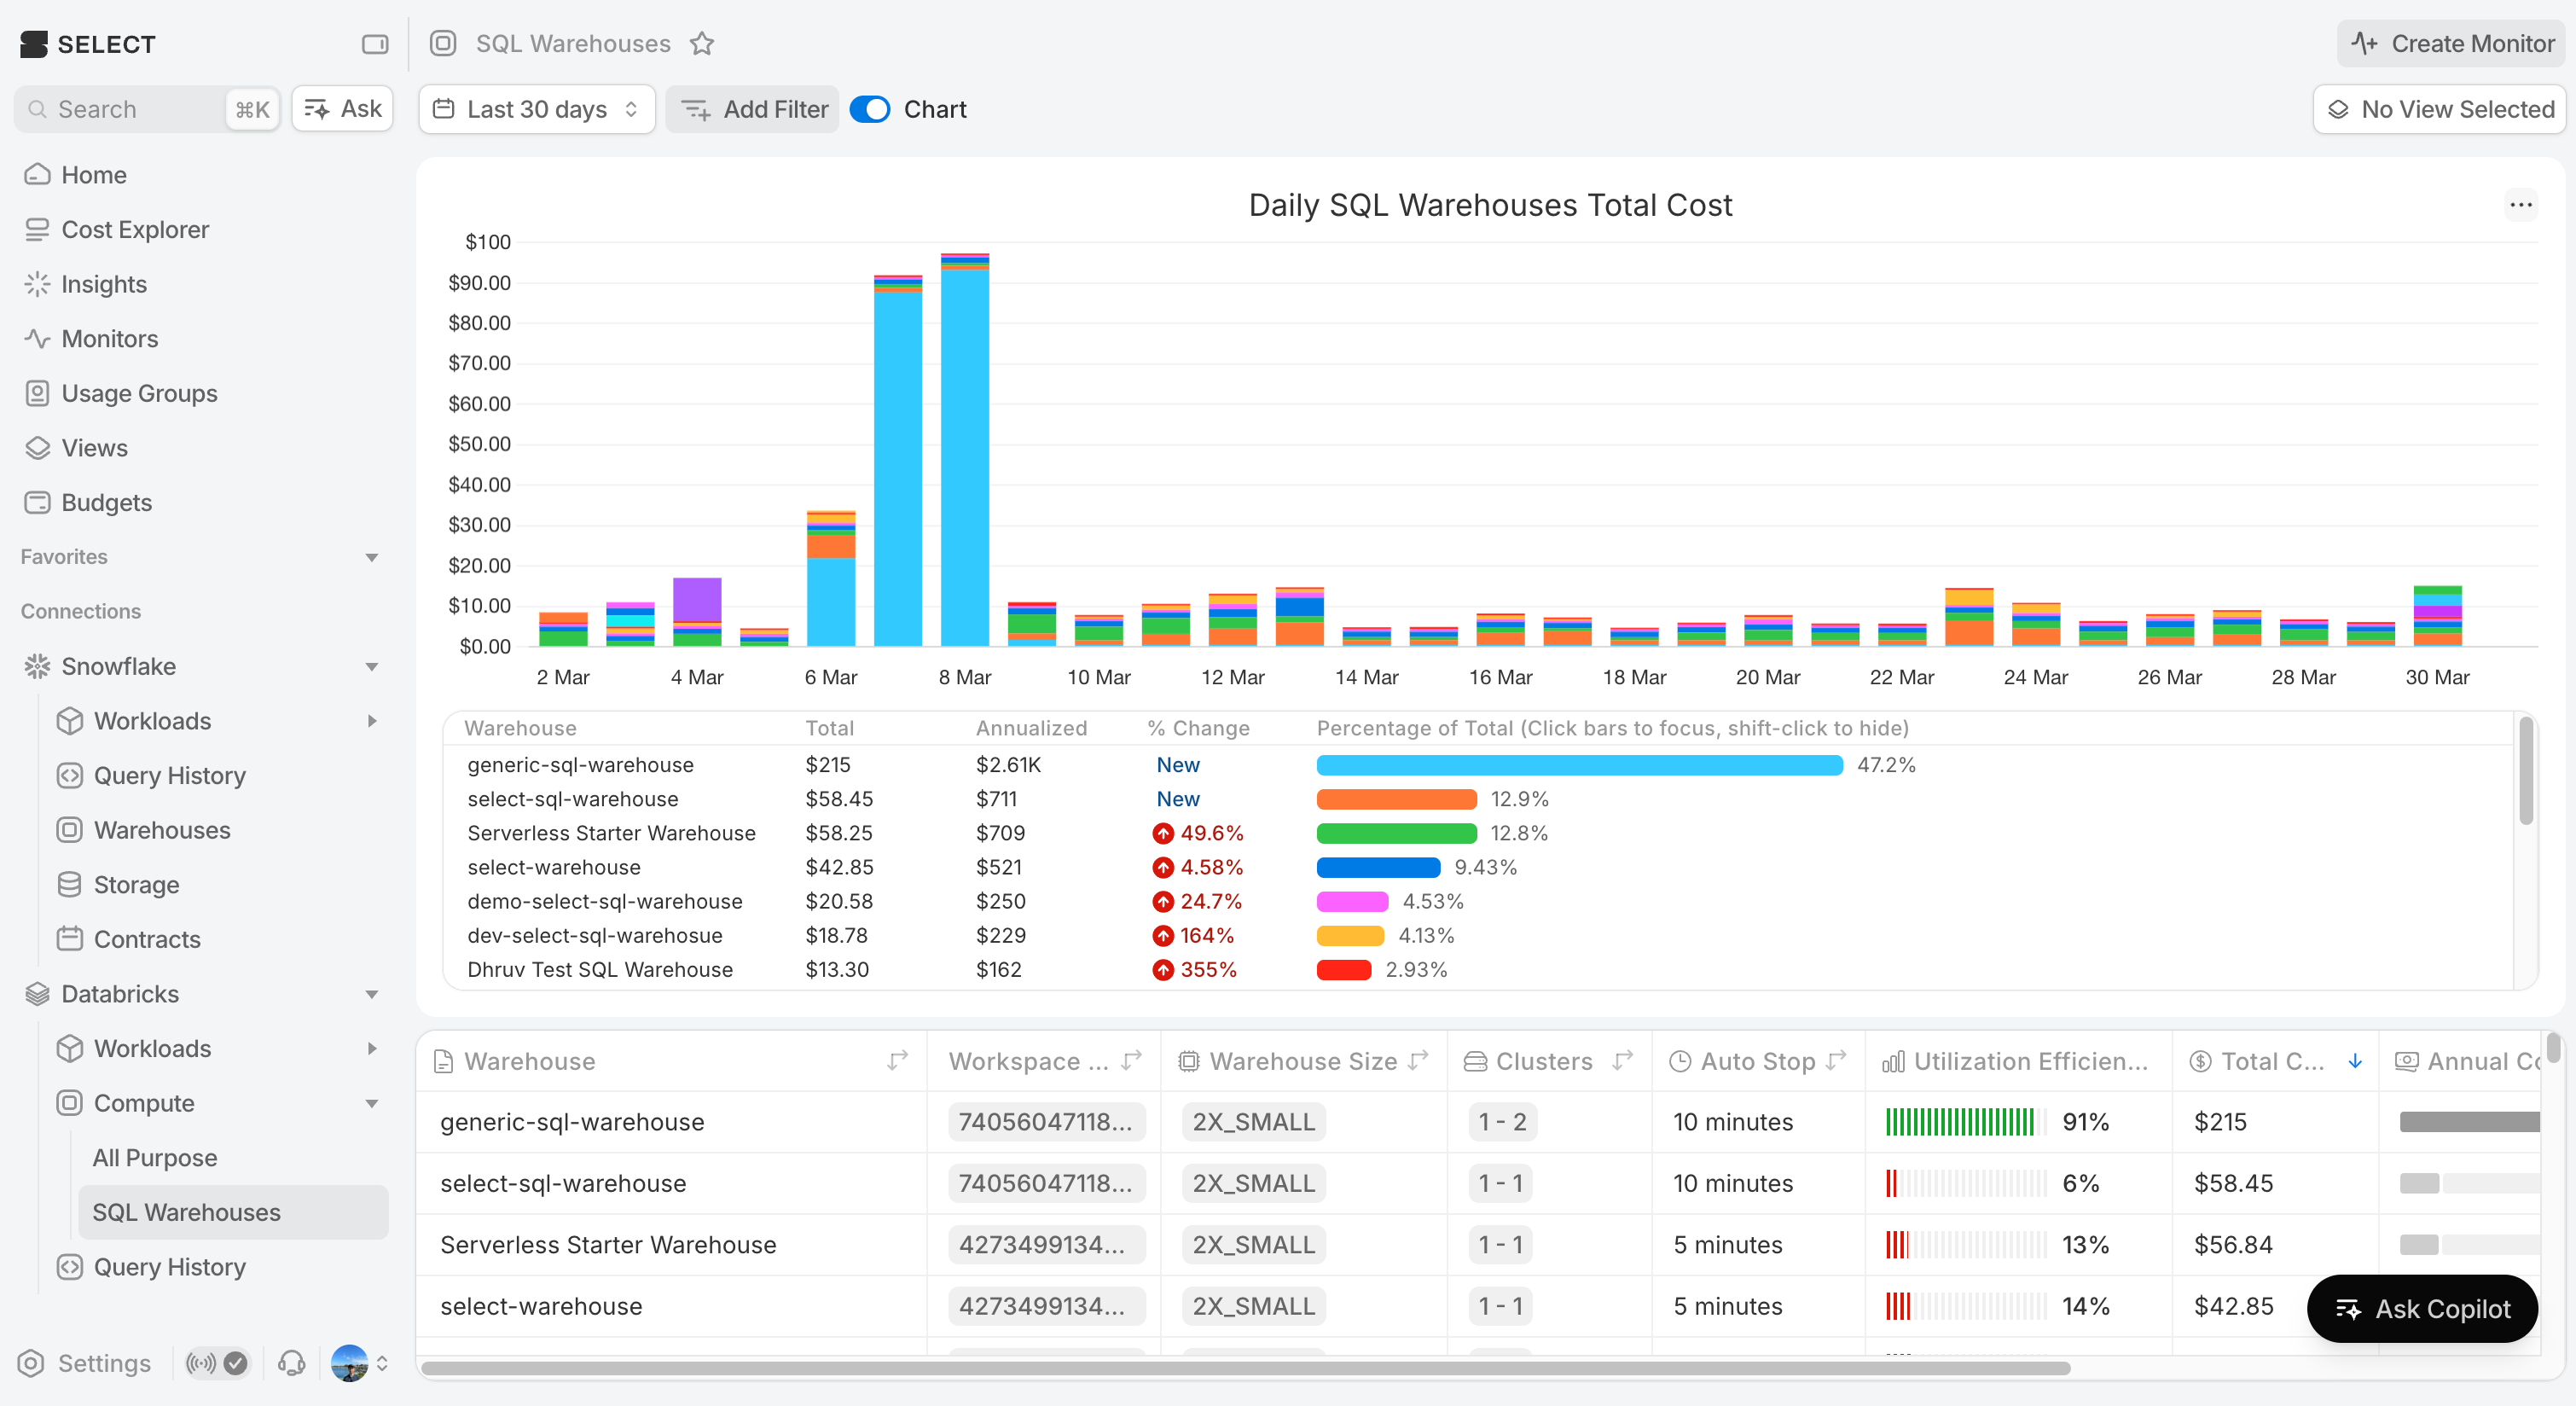
SQL Warehouses
Track spend across all SQL Warehouses. Compare usage patterns and spot over-provisioned or under-utilized warehouses with flexible date ranges and grouping.
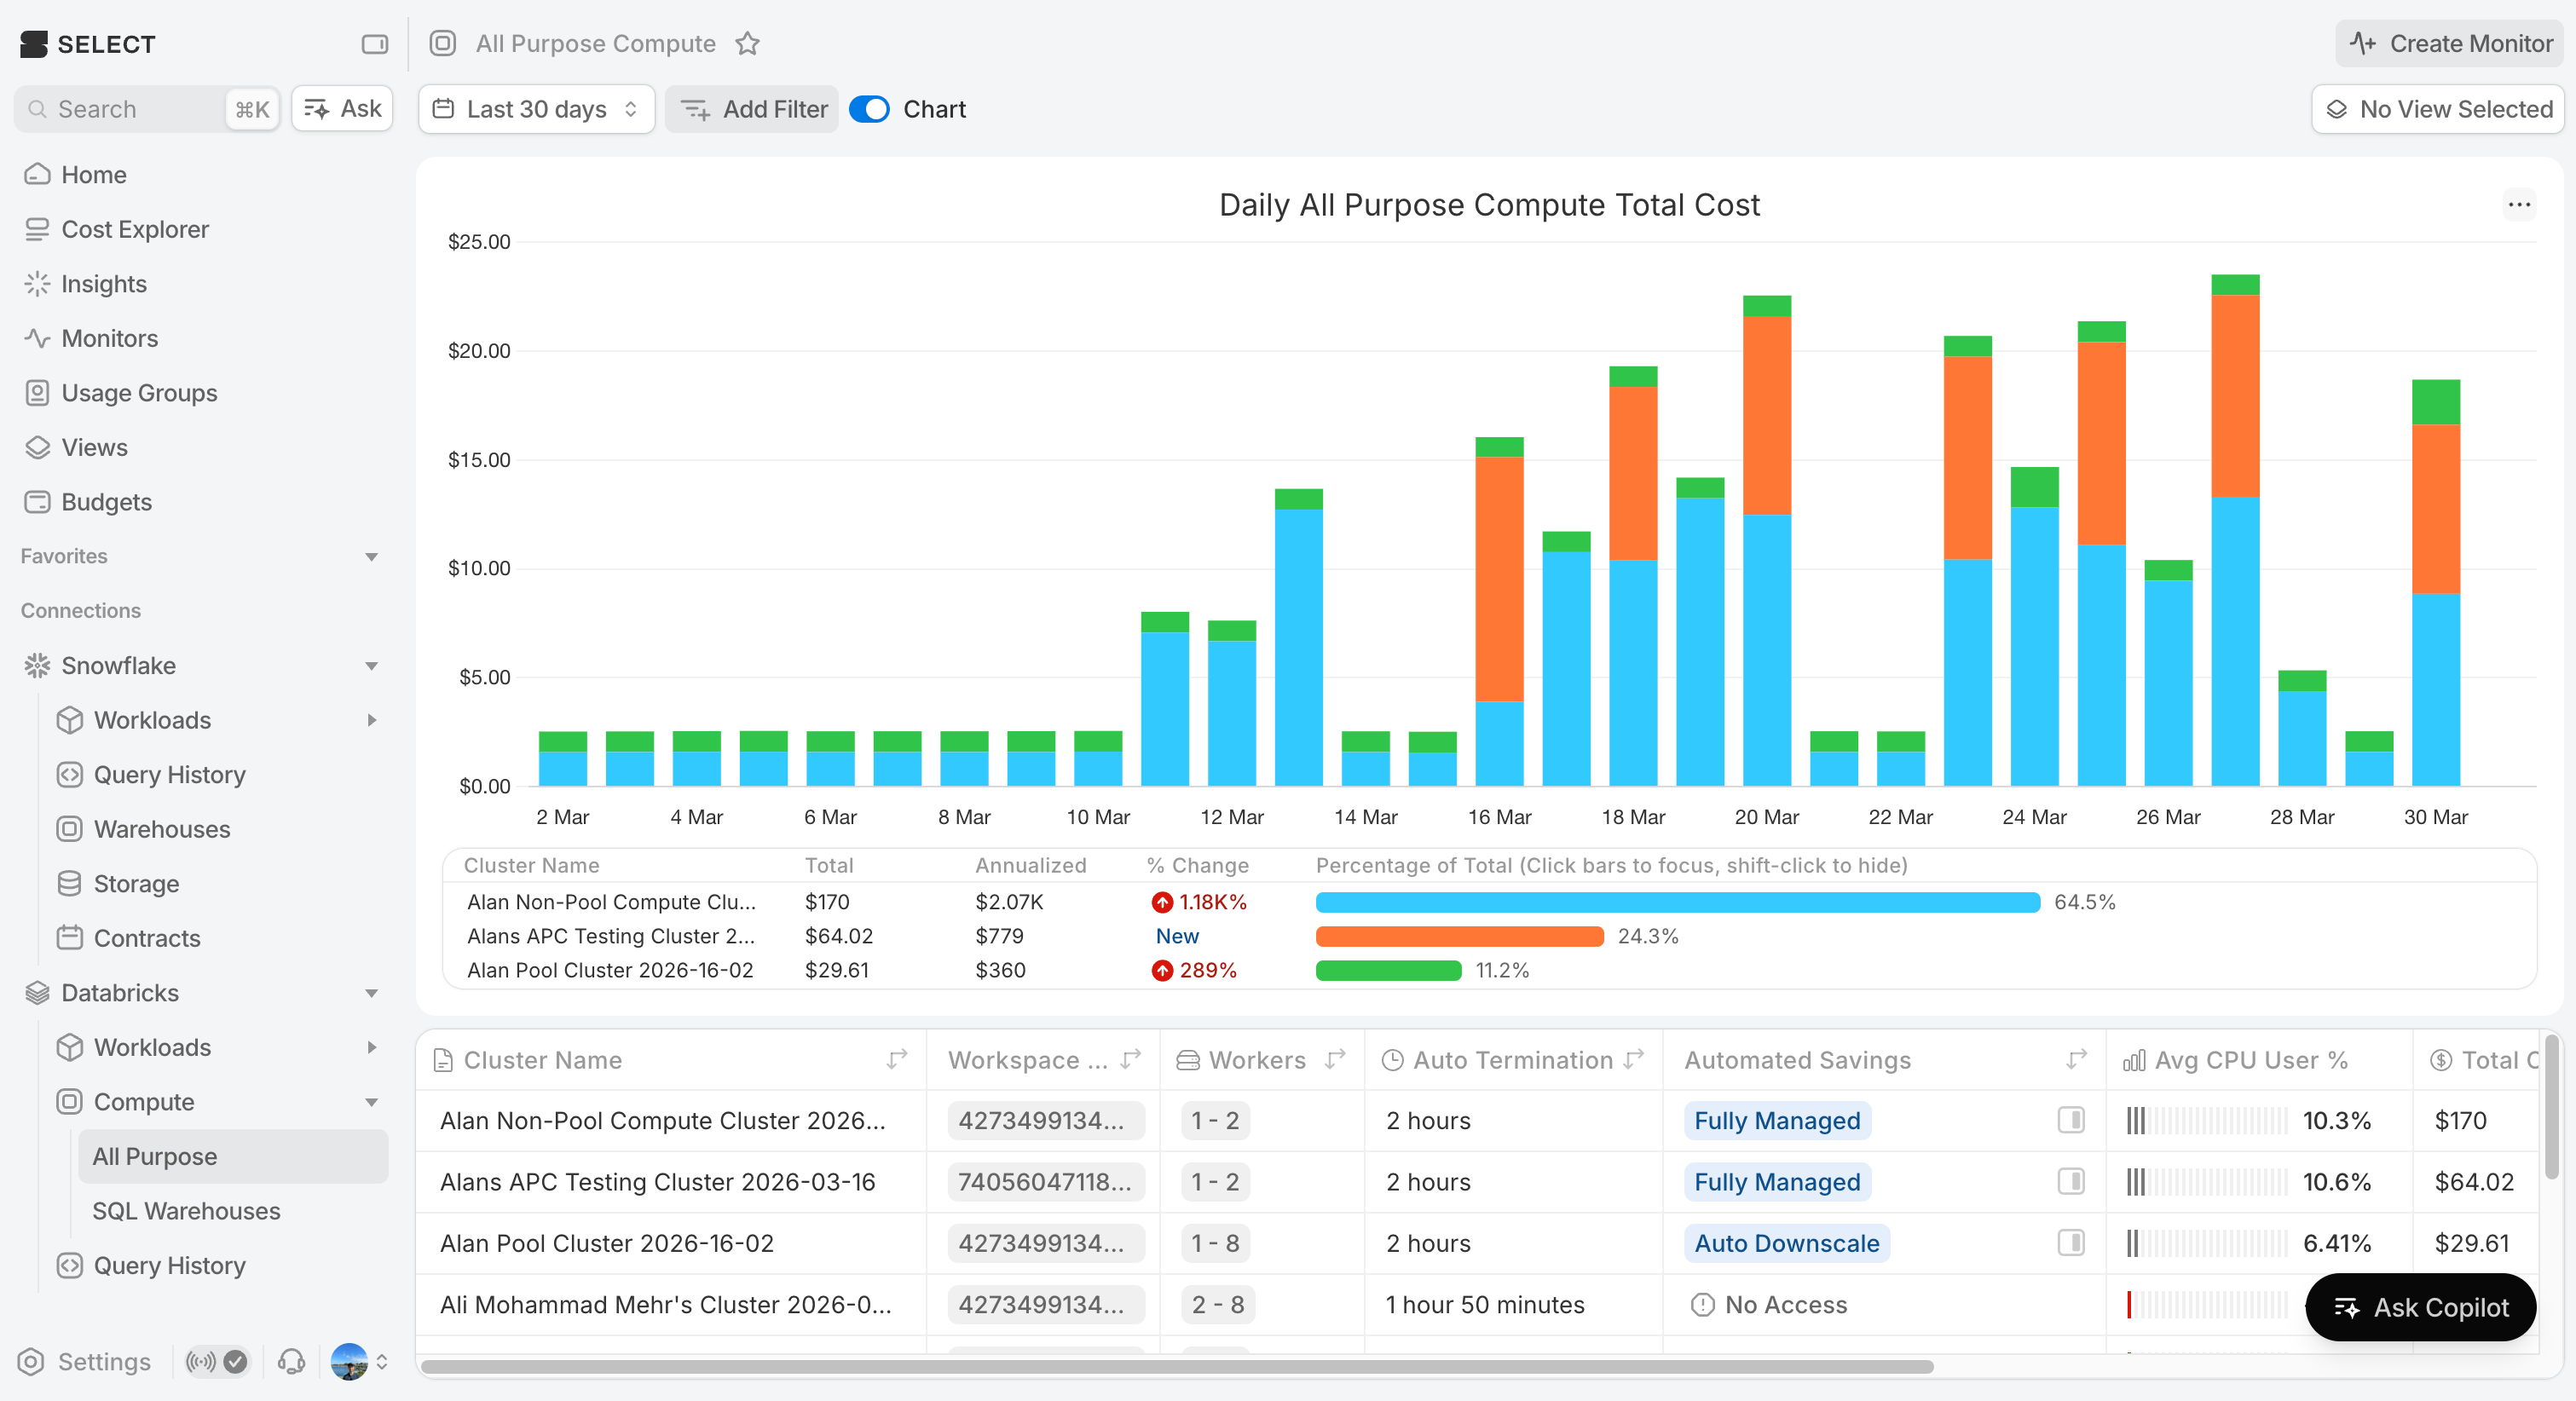
All Purpose Compute
Monitor interactive cluster costs across all workspaces. See which clusters are driving spend, track usage trends, and identify performance optimization opportunities.
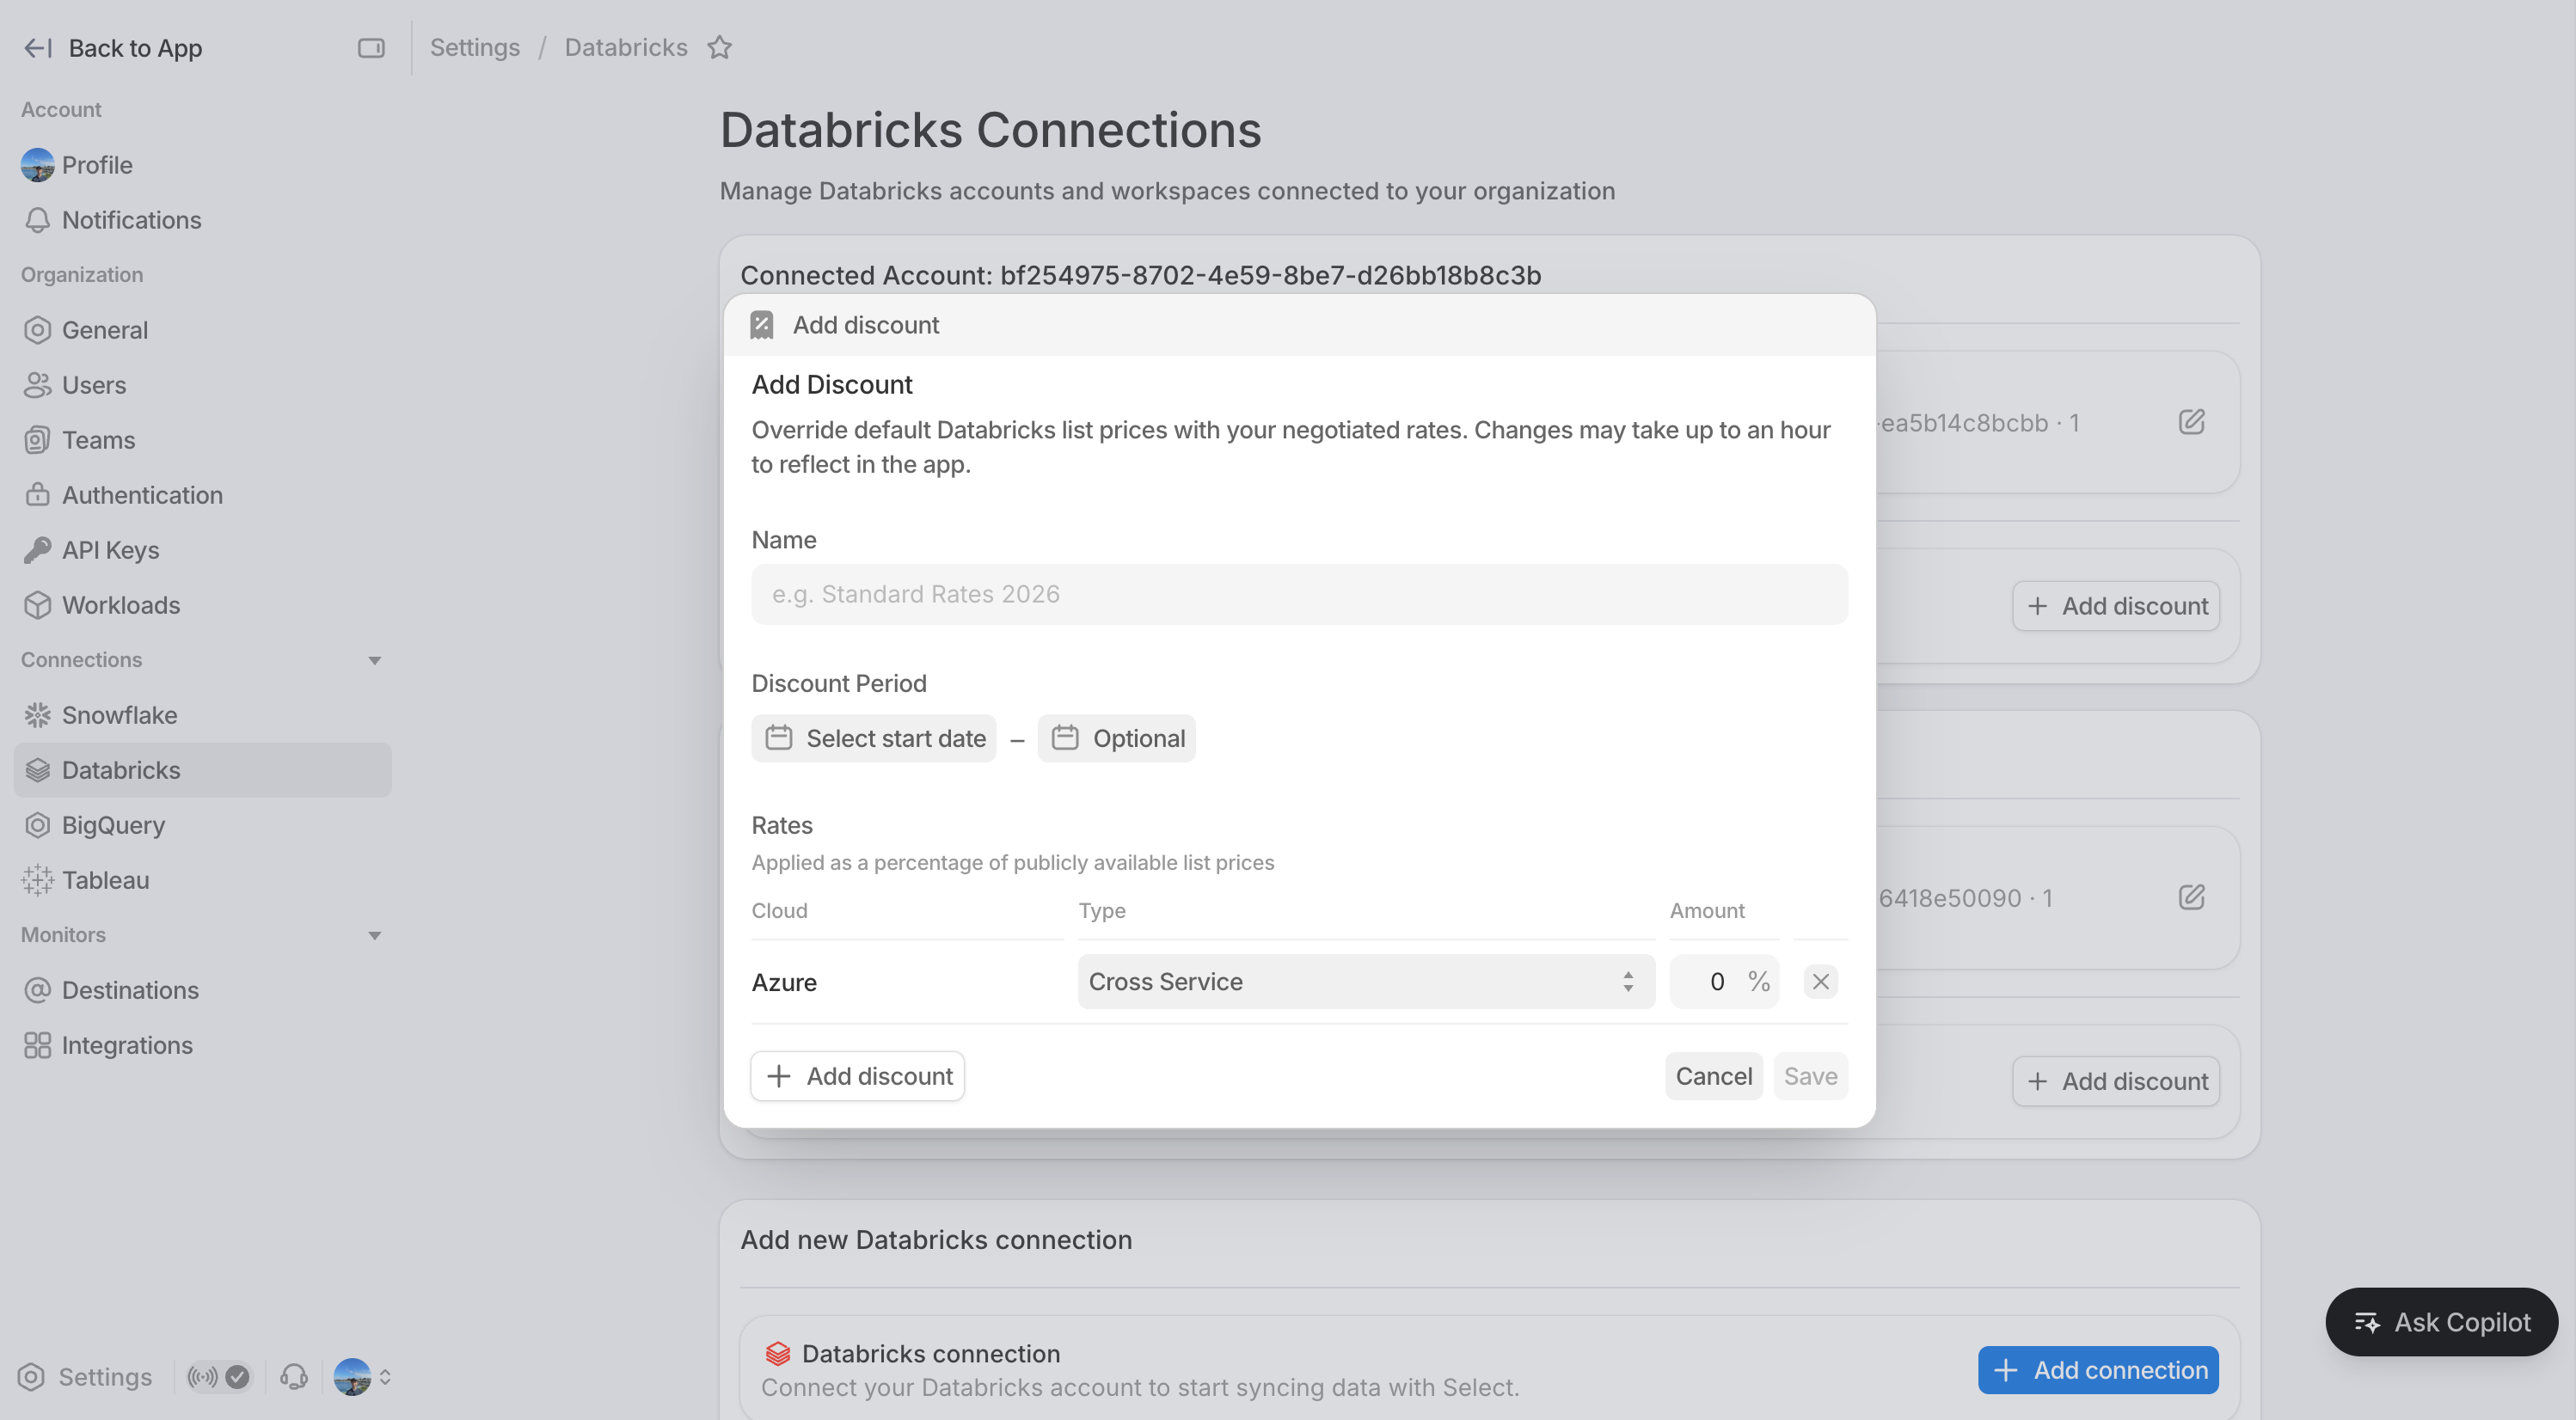
Custom Rates
If you've negotiated discounted pricing with Databricks, you can now configure custom rate sheets so your spend data reflects what you actually pay.
Getting Started
These pages are available in private preview. Interested in being an early partner? Sign up here!
Other Things We shipped
- 🚀 You can now assign multiple monitors to a team at once in the monitors overview page
- 🚀 Partition columns are now visible on the monitors overview page, giving better visibility without needing to drill into individual monitors
- 🐛 Fixed an issue where updating a dismissed monitor would sometimes un-dismiss it
- 🪄 Bytes related metrics are now more consistently available across workloads pages
- 🪄 Various small UI improvements and bug fixes
Up next.Previous Changelog Entries.