

SELECT’s AI Copilot is now available in Private Preview
Tuesday, November 04, 2025
 Jonathan TalmiProduct Engineer @ SELECT
When spend jumps or jobs slow, it can be difficult to pinpoint what happened. Our goal at SELECT is to make it as easy as possible to investigate and remediate cost and performance spikes.
Getting to the bottom of spikes isn’t always easy. Investigations often require digging through a multitude of dashboards, queries, and workloads. Today, we’re sharing a new tool with you that will make this much easier.
Meet SELECT Copilot!
Copilot is an AI-powered assistant that helps you analyze your Snowflake usage. It has access to the same analytics and insights available in the SELECT product, and it can retrieve data on-demand or perform complex investigations like a human analyst.
Here are some example use cases:
- Analyze cost spikes. Copilot drills down into anomalies until the root cause is identified.
- Catch performance regressions. Copilot compares workloads to historical baselines and surfaces the slowest queries and likely bottlenecks.
- Ask any questions about your Snowflake account. You can ask Copilot about your most frequently used tables, what queries recently hit timeout errors, or new warehouses that were created in the last 30 days.
How to use
We are in the process of integrating Copilot into the product more widely. There are two main ways to use it today:
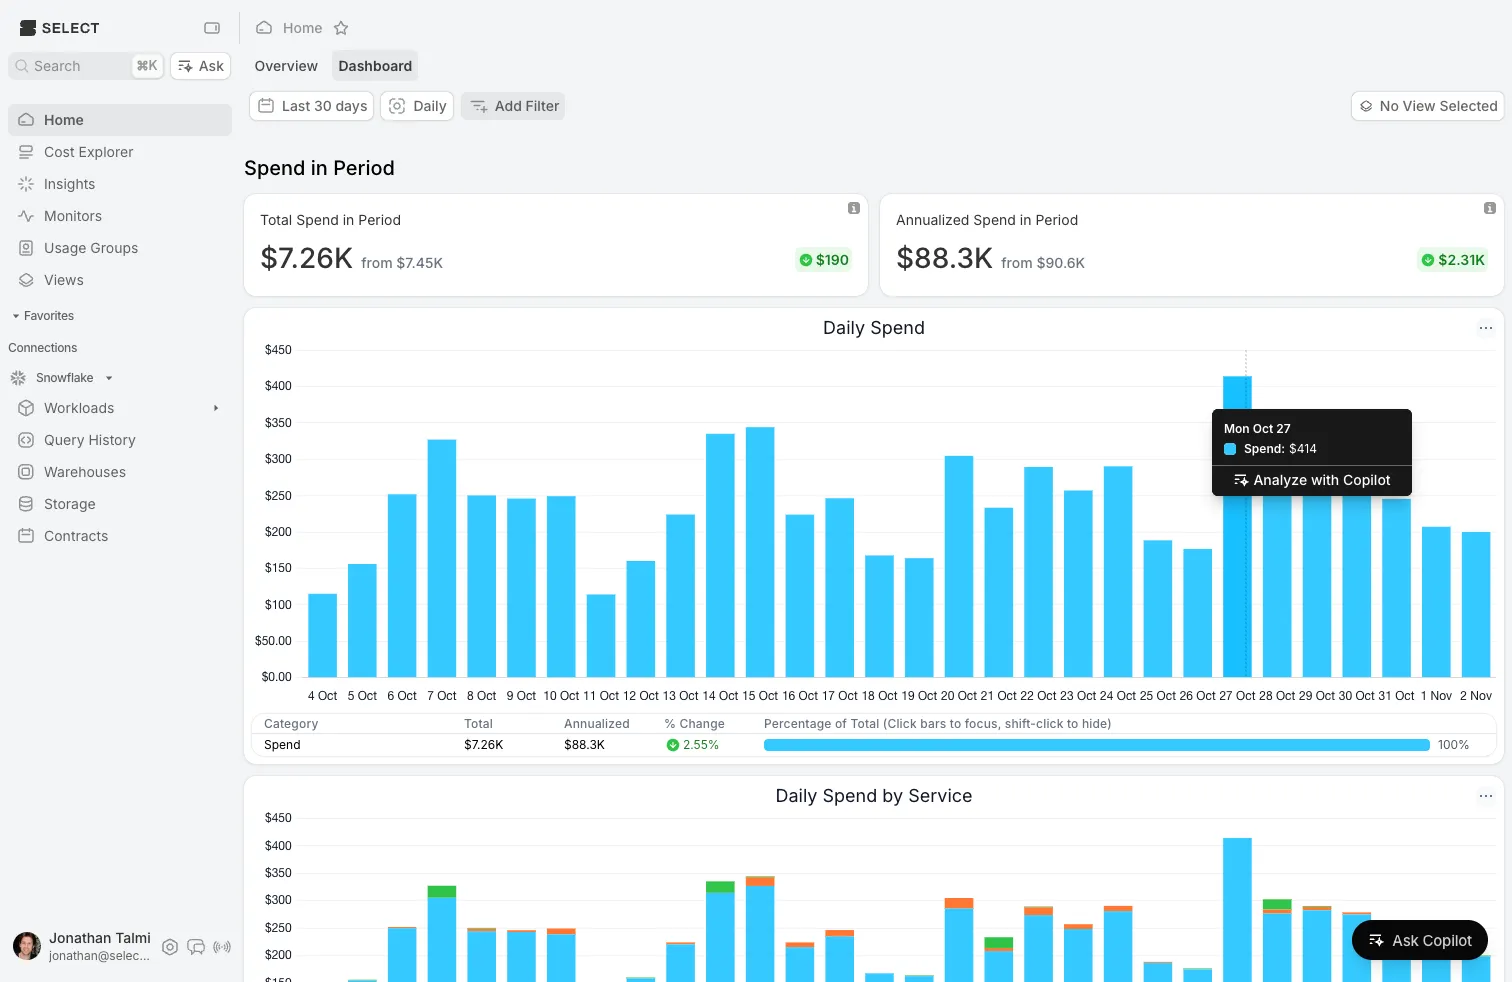
- Click on Ask Copilot in the bottom right or Ask in the left sidebar.
- On any chart, select a single data point and click Analyze With Copilot.
We will iterate on Copilot quickly based on feedback we collect from customers. We also expect to bring Copilot closer to where you work in the future.
We’re currently accepting customers into the private preview now. Email [email protected] to request access.
Other Things We shipped
- 🚀 added ability to duplicate monitors & usage groups
- 🚀 "Bytes Scanned" are now available in workload views.
- 🪄 Performance optimizations when using Usage Groups, resulting in up to 4x improvements in frontend performance for some use cases.
- 🪄 Improved monitor editability, by directly linking the associated form input within the monitor preview components
- 🪄 Improved cron inputs for monitors, providing previews of when the monitors will run based on the inputs
- 🪄 Improved performance in the Allocate Uncategorized Spend table for Usage Groups
- 🪄 Improved failed Monitor error state for better visibility
- 🐛 Fixed monitor preview for threshold monitors of threshold $0
- 🐛 fixed filtering search results
- 🐛 Back and forward buttons navigate through tabs correctly
- 🐛 Filtering past Insights (
Currentisfalse) in conjunction with Usage Groups has been fixed - 🐛 Fixed bug where filtering by empty Role, Warehouse, User or Object Tags was not returning any results
Up next.Previous Changelog Entries.