

Detect more granular issues with Partition Monitors!
Wednesday, October 15, 2025
 Ali Mohammad MehrProduct Engineer @ SELECT
Introducing Partition Monitors!
With our existing Monitors feature, SELECT customers can detect spend anomalies across a grouping of warehouses, workloads, or resources. When monitoring things in aggregate, you can potentially miss smaller changes due to larger variability when monitoring larger buckets of spend.
Previously, if you wanted to monitor individual users or warehouses for cost spikes, you would need to make a new monitor per user/warehouse, which is both time consuming and doesn’t scale to new users/warehouses that get added in the future.
Today, we are introducing Partition Monitors to greatly streamline such common use cases. Partition monitors will allow SELECT customers to detect spend anomalies across individual Snowflake users, warehouses, databases, workloads, or any other dimension in SELECT!
Unlike other monitors which detect anomalies across aggregate spend, partition monitors analyze each partition to see if it has an anomaly, allowing for fine grain detection of cost issues. For example, you could set up a single monitor to get notified if any dbt model (or other workload) spikes above its historical average. Same goes for Snowflake warehouses, users, or any other dimension available in SELECT.
Using Partition Monitors
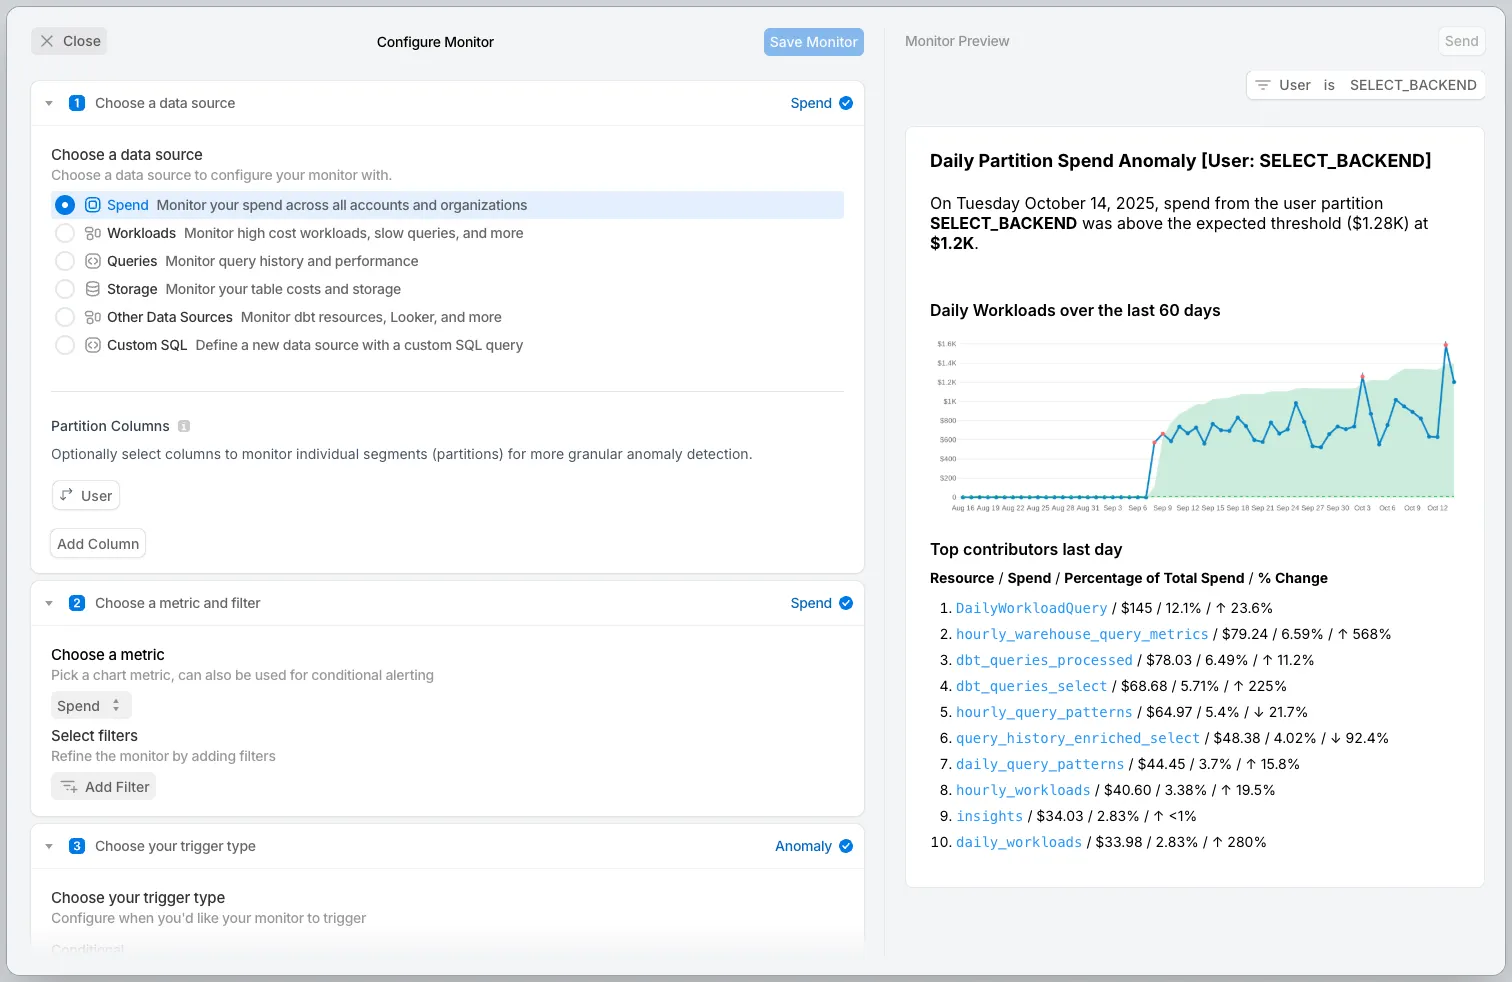
To create a partition monitor, in the form, you can select a "partition column" (see screenshot). Then, the monitor will check each individual partition ID (e.g. each individual user) against the trigger criteria and send a separate notification for each partition ID that goes beyond the trigger threshold.
Some other examples use cases include:
- Send a notification for each user that has a spike in cost.
- Send a notification for each warehouse that has a spike in cost.
- Send a notification for each workload that has a cost above $100 on the day.
Other Things We Shipped
- 🚀 We added support for workload identity federation when connecting your Snowflake account, allowing a more secure, credential-less auth option.
- 🪄 Added new Database/Schema/Tables Accessed/Modified filter options in Usage Groups, with performance improvements
- 🪄 The contract utilization page can now project the 'contract met by date' when the spend is increasing nonlinearly
- 🐛 Fixed a bug where destinations wouldn't be marked with a failing status on errors
Up next.Previous Changelog Entries.