Databricks Pricing Explained: The 3 Controls that Actually Matter

Olivier SoucyTuesday, April 28, 2026
TL;DR
Databricks bills you twice: once for DBUs (Databricks Units) and once for cloud infrastructure, and the two bills don't reconcile automatically. DBU rates vary up to 3.5x depending on compute type, and newer features like quality monitors follow separate billing models entirely. Three controls prevent most cost surprises: auto-termination on every cluster and warehouse, Job Compute for all scheduled workflows, and consistent tagging before you scale. None of these are complicated. Most teams skip them anyway.
How does Databricks billing actually work?
Databricks charges you in two separate places, and the two bills don't talk to each other.
The first bill comes from Databricks itself. It's denominated in Databricks Units (DBUs), an abstract measure of compute capacity consumed per second. The price per DBU varies depending on what type of work you're running, which cloud provider you're on, and which Databricks edition you've purchased.
The second bill comes from your cloud provider (AWS, Azure, or GCP). This is where the underlying virtual machines, storage, and network egress show up.
That dual structure trips up a lot of teams early on. The Databricks system tables give you a clean cost breakdown by workload and SKU, but that view only covers the DBU side. The cloud infrastructure charges live in a separate billing export, and reconciling the two is genuinely non-trivial. It gets even harder when your environment mixes classic and serverless compute: classic clusters have associated VM costs in your cloud bill, while serverless bundles the infrastructure into the DBU price. Two different cost structures, one workspace. Most teams don't fully account for the cloud side until their first uncomfortable invoice.
Understanding your total costs of operation is such a challenge that Databricks released an open source utility to facilitate this exercise: https://www.databricks.com/blog/getting-full-picture-unifying-databricks-and-cloud-infrastructure-costs
What is a DBU, and why does the rate vary so much?
A DBU is a normalized unit of processing capacity. Think of it as a credit that gets consumed whenever compute is running. The catch is that the dollar value of one DBU is not fixed. It depends on three things:
1. Compute typeThis is the biggest multiplier. Running a scheduled batch job using Job Compute costs roughly $0.15/DBU on Azure. Running the same code interactively on an All-Purpose cluster costs $0.55/DBU. That's not a small difference; it's 3.5x. Teams that let production pipelines run on All-Purpose clusters because "it was already there" are paying that premium on every run.
Here's a reference table for Azure (US region, list prices):
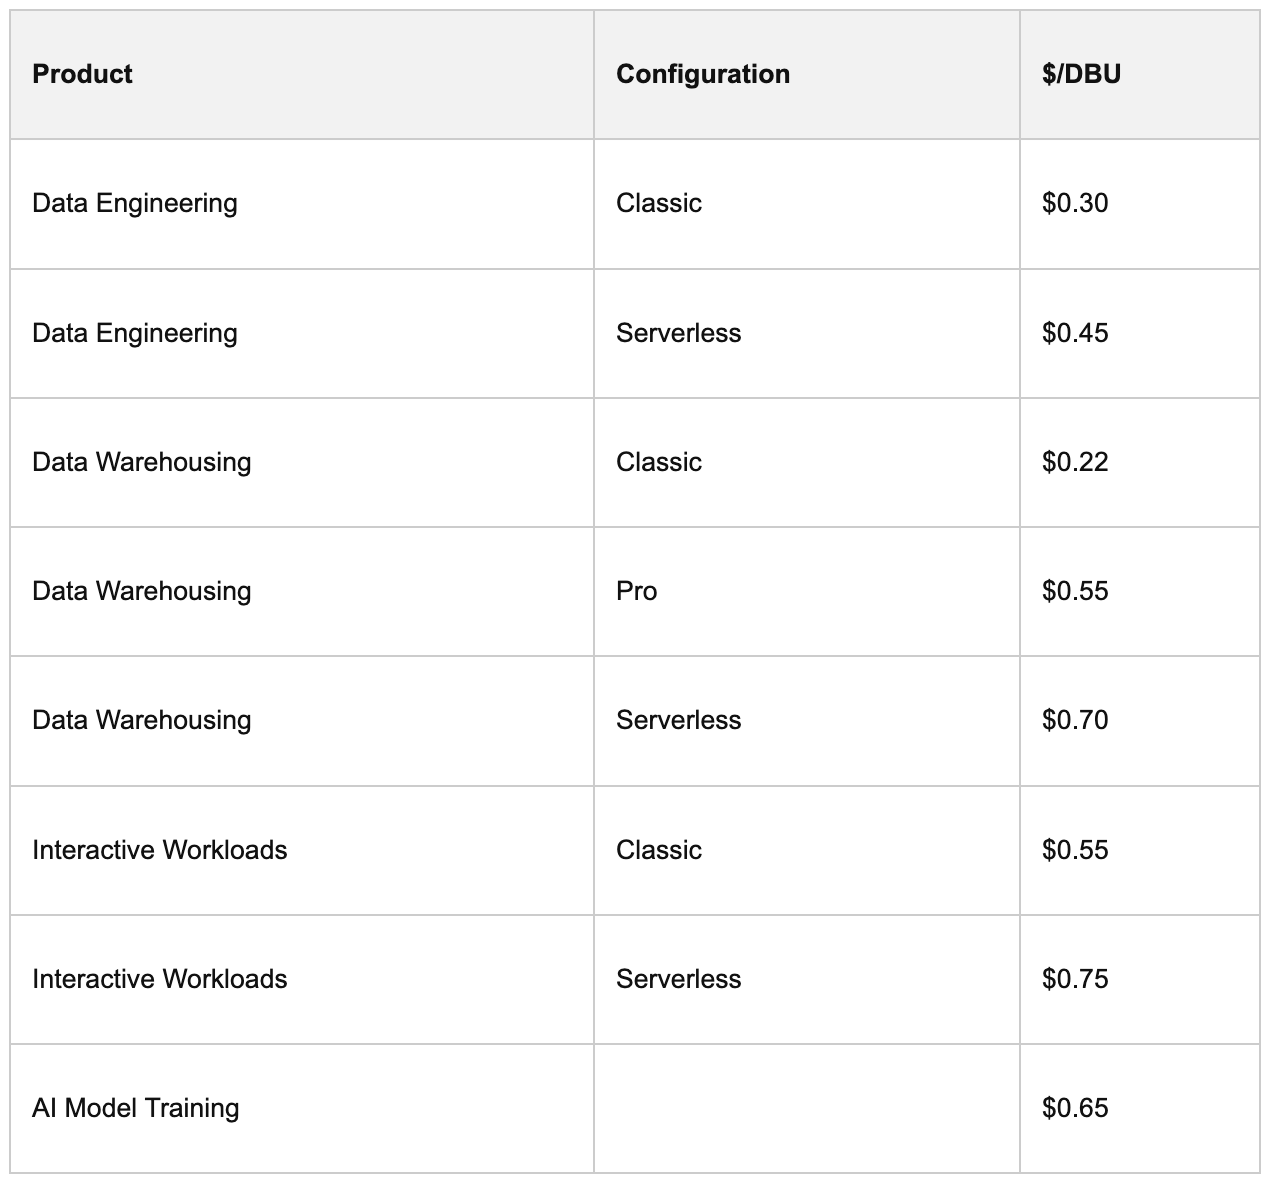
Full pricing at databricks.com/product/pricing.
2. Serverless vs. classicServerless compute has a higher per-DBU rate because it bundles infrastructure management into the price, with no VM charges on the cloud side. Classic compute has a lower per-DBU rate, but you pay for the underlying VMs separately. Neither is universally cheaper; it depends entirely on your workload.
3. Not everything is DBU-pricedNewer Databricks capabilities, including data ingestion, vector search, AI agents, quality monitors, and operational databases, often follow entirely different models: per token, per GB stored, per hour of capacity. This is one of the most overlooked sources of bill surprises. More on that below.
What hidden costs caught a client off guard with quality monitors?
Speaking of non-DBU costs: quality monitors are one of the sneakiest cost drivers I've seen in practice.
For small tables, a quality monitor update is cheap, typically around $0.10 per run. But for large, historical tables without Change Data Feed (CDF) enabled, the monitor has to scan the entire table on every execution. For some large tables, that's $20 per update.
A client of mine had deployed quality monitors across hundreds of tables. About 95% of them ran cheaply, no problem. But a handful of large tables without CDF were costing $20 per run, scheduled daily. That alone was generating a substantial portion of their monthly bill, and nobody knew until we dug into our Costs Monitoring Dashboard. The quality monitors panel doesn't surface this prominently. You have to look for it.
The fix is simple: enable CDF and use time-series instead of snapshots quality monitors. But you have to know what you are doing.
This is also a good example of why "DBU cost" alone doesn't tell the full story. Quality monitors have their own billing dimension, separate from your cluster or warehouse consumption.
Should you use serverless or classic compute to save money?
Serverless compute costs 1.5 to 2x more per DBU than its classic equivalent. That makes it sound like the wrong choice for cost-conscious teams. It usually isn't, but there's a nuance worth understanding.
The case for starting with serverless is straightforward: it removes an entire class of configuration problems. No cluster sizing decisions, no autoscaling tuning, no auto-termination to forget, no idle clusters sitting overnight. The operational overhead disappears, and for most workloads, that engineering time costs more than the DBU premium.
The nuance is this: serverless scales so efficiently that cost increases can be harder to spot. With classic compute, if a job consistently takes one hour, you have a reasonable expectation of what it costs. With serverless, two runs might take the same wall-clock time but have very different costs, because serverless scaled up quickly in response to a heavier workload and you consumed twice the DBUs. The duration stays the same. The bill doubles.
This doesn't mean serverless is wrong. It means you need proper cost monitoring in place, not just duration tracking. Watch DBU consumption, not just execution time.
My recommendation: start serverless across the board. Use your cost monitoring system to identify the high-cost, high-frequency jobs that run predictably enough to justify the effort of configuring classic compute properly. Optimize the outliers. Don't try to hand-tune everything.
What are the 3 cost controls to put in place before you need them?
Understanding the pricing model is useful. Actually doing something about it is the part that moves the needle. Here are the three controls that deliver the most impact with the least engineering effort.
1. Auto-Termination on Every Cluster and Warehouse
This is the single most impactful control, and the one most often skipped.
Without auto-termination, a cluster that finishes its work simply sits there, consuming DBUs at full rate until someone manually stops it. The damage isn't usually one big cluster; it's the accumulation of many clusters, each left running a few extra hours, across an entire team, every day.
I've seen this go badly twice in memorable ways.
The first: an intern was doing ML model training and configured a large cluster with a five-day auto-termination window, thinking that was a sensible ceiling for a training run. The job finished in hours. The cluster kept running. Nobody noticed for over a month. That single cluster was 15-20% of the total Databricks bill for that period.
The second: a pipeline reading highly nested JSON files worked perfectly in the test environment. It was deployed to production. The production files had a different structure. The pipeline didn't fail; it just ran. For ten hours. Every day. Nobody was watching. It had to be stopped manually and fixed. A job timeout would have caught it on the first run.
How to configure:
- Interactive clusters: set auto-termination to 30 minutes
- SQL warehouses: set auto-stop to 10 minutes (serverless warehouses start in seconds, so the cost of a restart is low)
- Every scheduled job: set a timeout at 2x the average run duration
One important caveat: notebooks have no native timeout mechanism. A notebook that's actively executing will keep the cluster alive indefinitely, because auto-termination never triggers when the cluster isn't idle. A streaming query displayed in a notebook is enough to keep a cluster running forever. The only protection here is monitoring cluster uptime through system tables and setting alerts for anything running longer than expected.
2. Use Job Compute (Not All-Purpose) for Scheduled Workflows
This is the easiest cost reduction most teams haven't done yet.
When you define a Databricks workflow, the temptation is to attach it to an existing interactive cluster. It's already there, it's already configured, it works. The problem is that interactive (All-Purpose) compute runs at roughly $0.55/DBU, while Job Compute runs at $0.15/DBU for classic and $0.35/DBU for serverless. For a production pipeline that runs multiple times per day, that gap adds up fast.
The right approach is to treat compute as a per-task decision. A workflow with a Python transformation followed by a SQL aggregation can and should use serverless Job Compute for the first task and a SQL warehouse for the second. You're not locked into one compute type for the entire workflow. Pick the cheapest appropriate option for each task.
Rule of thumb: if it's scheduled, it shouldn't be running on All-Purpose compute.
3. Tag Everything Before You Scale
Tags feel like a housekeeping task. They're actually a cost management prerequisite.
Databricks system tables give you raw DBU consumption data. Tags are what let you answer the question that actually matters: which team, project, or pipeline is driving this cost?
Without tags, you end up drowning in cluster names that change over time (etl_dev, etl_staging, prod_churn_v2) and usage records that are impossible to group meaningfully. With tags, you can slice costs by business unit, environment, and workflow with a simple query.
Good tags to start with:
- Business unit: which team owns this workload
- Environment: production, staging, development
- Project: what initiative this serves
- Workflow name: a stable logical name that survives renames
On AWS and Azure, tags also propagate to your cloud provider's billing data, which is the only reliable way to reconcile your Databricks DBU costs with the cloud VM charges on the other bill.
The practical advice: define your tagging taxonomy before you have dozens of pipelines. Retrofitting tags across a mature environment is painful. A handful of well-chosen tags applied consistently from day one is worth more than an elaborate schema nobody follows.
For serverless compute specifically, there's an additional step: since serverless has no persistent cluster to tag, you need to configure serverless budget policies to attach tags to serverless usage. Without this, serverless consumption lands in your system tables with no attribution context.
Want to cut your Databricks bill by 30%? Our free ebook covers auto-termination, Job Compute, budget policies, and 17 more fixes you can apply today. No fluff — just the configurations that actually move the needle. Get your free copy →
Where do you start if you're looking at a confusing Databricks bill right now?
If your Databricks costs are already higher than expected, the fastest diagnostic is to query your system tables:
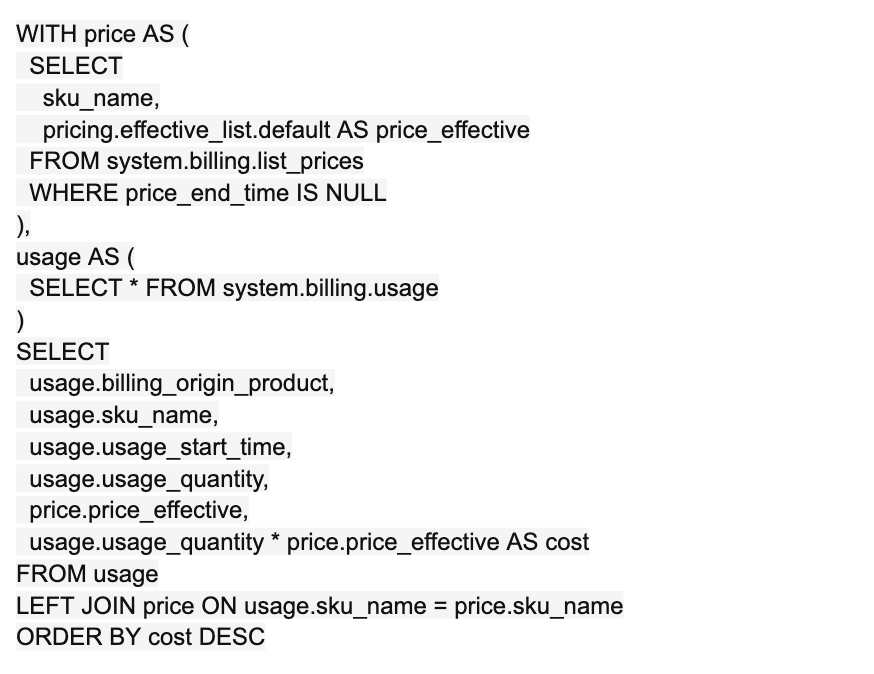
This gives you a cost breakdown by product and SKU. To connect it to actual workloads, join in system.lakeflow.job_run_timeline to see which jobs are driving the bill.
A few things to look for specifically:
- Any Interactive Workloads SKU usage that should be Job Compute
- Any quality monitor line items, especially on large tables
- Long-running clusters or warehouses relative to the work they're doing
Remember that this view only covers the Databricks side. The cloud VM costs are in a separate export from your cloud provider. If you're on a mixed classic/serverless environment, those two views need to be reconciled separately.
How do you keep Databricks costs under control as you scale?
The three controls above will handle the most common sources of waste. Keeping them in place as your team and workload grow requires a governance layer:
- Deploy clusters as infrastructure as code rather than letting engineers provision their own. When configuration is in YAML and goes through CI/CD, auto-termination and tagging are always set correctly because they're enforced in the definition, not left to individual discretion.
- Use cluster policies for teams that genuinely need to create their own compute. Policies constrain the configuration space: they can enforce auto-termination, cap cluster size, and restrict instance types while still giving engineers meaningful flexibility.
- Set cost alerts in the Databricks account console, or build custom alerts on top of system tables. Measuring the standard deviation of daily costs per workload is a more sensitive early signal than a fixed threshold. It catches drift before it becomes a problem.
Cost optimization in Databricks isn't a one-time project. The platform evolves, teams add workloads, data volumes grow. The teams that stay ahead of costs treat monitoring and attribution as a continuous practice, not a cleanup exercise after something goes wrong.
FAQ's
Why is my Databricks bill higher than expected? The most common reason is compute type mismatch: production pipelines running on All-Purpose interactive clusters instead of Job Compute. All-Purpose compute costs up to 3.5x more per DBU than Job Compute. The second most common reason is idle clusters with no auto-termination set. Query system.billing.usage joined to system.billing.list_prices and sort by cost descending — the culprit is usually in the top five rows.
What's the difference between Databricks DBU costs and cloud infrastructure costs? DBU costs appear on your Databricks invoice and cover compute capacity consumed. Cloud infrastructure costs appear on your AWS, Azure, or GCP bill and cover the underlying VMs, storage, and network egress. For classic clusters, both apply. For serverless, infrastructure is bundled into the DBU rate and there's no separate cloud VM charge. Most teams only see the DBU side until the first invoice where the cloud side surprises them.
Is serverless compute more or less expensive than classic in Databricks? It depends on the workload, but serverless usually costs less in practice despite a higher per-DBU rate. The higher rate is offset by not paying for cloud VMs and by not paying for idle time — serverless spins down immediately when work is done. The risk with serverless is that cost increases are harder to spot: two runs can take the same wall-clock time but consume very different DBU quantities if one workload was heavier. Monitor DBU consumption, not just execution duration.
Fractional Data Platform Engineer | Open-source Developer | Databricks Partner
Want to hear about our latest data cloud learnings?Subscribe to get notified.
Get up and running in less than 15 minutes
Connect your Snowflake, Databricks, or BigQuery account and instantly understand your savings potential.