An Engineer's Guide to Databricks Photon

Ian WhitestoneThursday, September 10, 2026
Photon is one of several Databricks cost drivers worth understanding before optimizing a workload.
On classic clusters, Photon-enabled compute consumes Databricks Units (DBUs) at roughly twice the rate of equivalent non-Photon compute, although the exact multiplier varies by instance type. Some workloads finish fast enough to offset that higher DBU rate. Others get faster and still cost more, so runtime alone does not tell you whether Photon is saving money.
LakeSentry, in a community-reported analysis of Databricks pricing, calls out Photon as one of the cost drivers behind pricing surprises that the rate card does not make obvious. The extra DBU consumption pays off only when the workload gets enough speedup in return.
This guide focuses on Databricks Photon, how it affects cost, where the break-even point sits, and how to tell whether enabling it makes a workload cheaper.
TL;DR
- On classic clusters, Photon needs more than a 2× speedup to offset its higher DBU rate.
- Scans, aggregations, and joins can clear that threshold, while Python UDFs, short jobs, and wide-shuffle workloads often fall below it.
- You pay the Photon rate even when only part of the workload runs through Photon.
- Check Photon coverage in the query profile's Aggregated task time panel, then compare the actual DBU totals before and after enabling Photon.
What is Databricks Photon?
Databricks Photon is a query engine that improves performance for supported Spark data processing.It runs supported operations in native C++ while Spark's Catalyst optimizer still handles query planning.
One important difference to note is how Photon processes data. Instead of executing one row at a time, it works on batches of columnar data across supported data types and uses Single Instruction Multiple Data (SIMD) instructions to process multiple values with a CPU instruction. That reduces the overhead of the JVM execution path and speeds up processing for operations such as scans, filters, aggregations, joins, and sorts, when Photon supports them.
Photon does not replace Spark but instead acts as a native execution layer underneath the same Spark programming model. Your Spark or SQL queries still go through Catalyst for planning, then supported parts of the physical plan can run in Photon. Unsupported operations fall back to the standard Spark runtime.
That last part matters for cost. Enabling Photon does not mean every operation in a job runs through Photon. The operator mix determines how much of the workload can use Photon, so you need to measure it before judging performance or cost.
The DBU multiplier and the break-even math
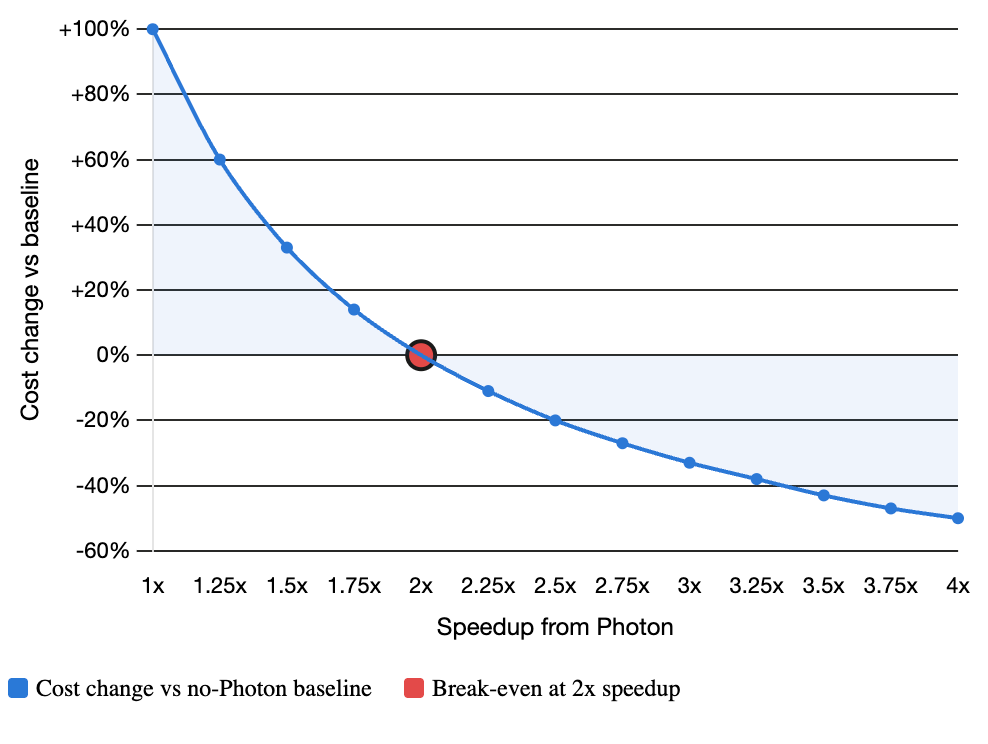
If Photon consumes roughly 2× the DBUs on a classic cluster, a job needs to run more than 2× faster before the higher compute rate turns into a saving. That is the line to keep in mind when you look at a Photon benchmark.
Take a job that normally runs for 60 minutes. At 1.5× speedup, Photon gets it down to 40 minutes, but the 2× DBU rate means you still consume about 33% more DBUs. Push the speedup to 3×, and the job finishes in 20 minutes, consuming about two-thirds as many DBUs. That's roughly a 33% saving. At 2×, the shorter runtime and higher DBU rate cancel each other out.
Where you land depends heavily on what the query is actually doing. A scan-heavy job reading Parquet or Delta with selective filters gives Photon plenty of native execution work. So does a large aggregation over a fact table or a hash join where one side can be broadcast. Those are the workloads where published benchmarks have shown speedups above the 2× break-even point.
The picture changes when the expensive part of the job isn't something Photon can accelerate. A Python UDF can push execution back through the JVM and Python. A short job may spend more time in planning and scheduling than actual execution. A wide shuffle can spend its wall time moving data across the network or waiting on disk. Making the CPU portion faster doesn't help much when the CPU isn't what the job is waiting on.
The table below puts the 2× break-even point into context, showing which workload shapes are likely to clear it and which ones aren't.
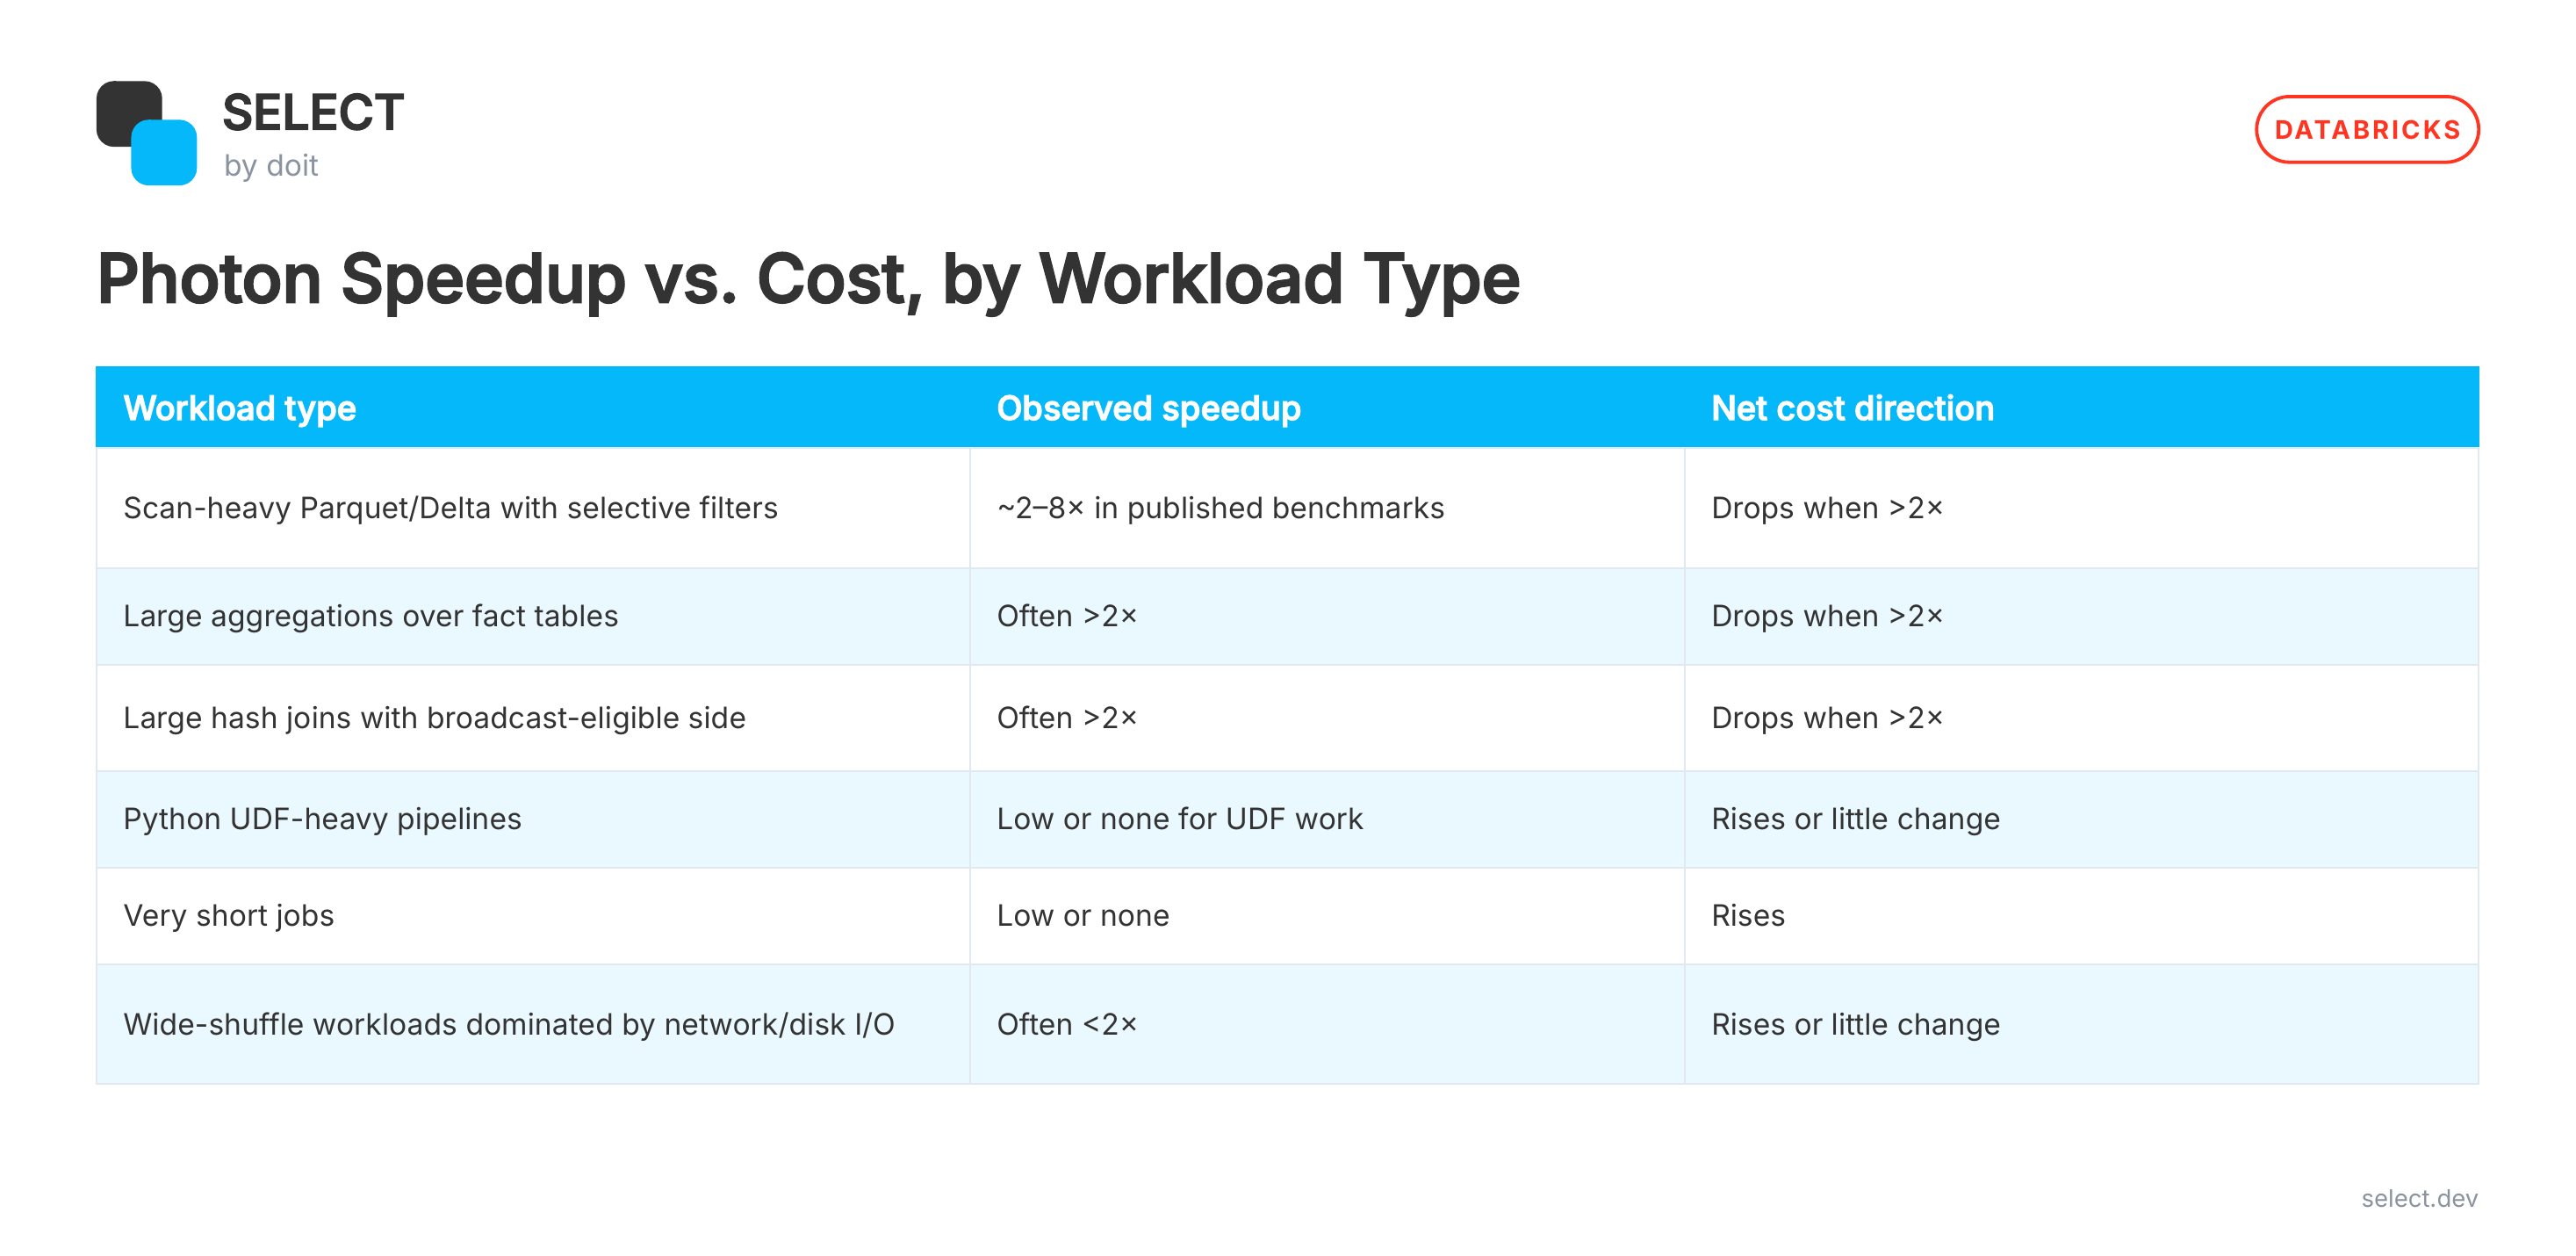
Cost direction assumes a roughly 2× Photon DBU multiplier on equivalent classic-cluster compute. Actual DBU rates vary by instance type, so the measured speedup is what determines the result.
The 2× threshold gives you the math. The execution plan tells you whether your job has a realistic shot at clearing it.
Operator coverage: what runs natively and what falls backWhich operators does Photon run natively, and which ones fall back?
Photon doesn't run every Spark operator. Some operators run natively, and others fall back to the JVM. You still pay the Photon-enabled compute rate even when the expensive part of the workload isn't running natively.
Take a query that reads a large Delta Lake table, filters most of the rows out, aggregates what remains, and joins the result to another table. Those are the kinds of operations where Photon has real CPU work to optimize. Now drop a Python UDF into the middle. That piece takes a different execution path, and if the UDF is where the job spends most of its time, Photon doesn't touch the bottleneck. A Photon-enabled cluster doesn't mean the whole query runs in Photon. The physical plan decides which parts actually do.
For common data workloads, Photon can run Parquet and Delta scans, filters, projections, aggregations, and hash joins natively. Window functions and sorts are also supported, along with common string operations. Python and Scala UDFs fall back, while some regex, MAP``/``STRUCT, streaming sink, and CSV/JSON operations depend on the specific operation and Databricks Runtime version. Where you can, replace a UDF with a built-in Spark SQL function to keep more of the work on the native path. If scan time dominates the job, how your tables are laid out affects what Photon has to scan. Liquid Clustering is worth a look for that side of the problem.
The table below shows the workloads Photon can execute natively and where it falls back:
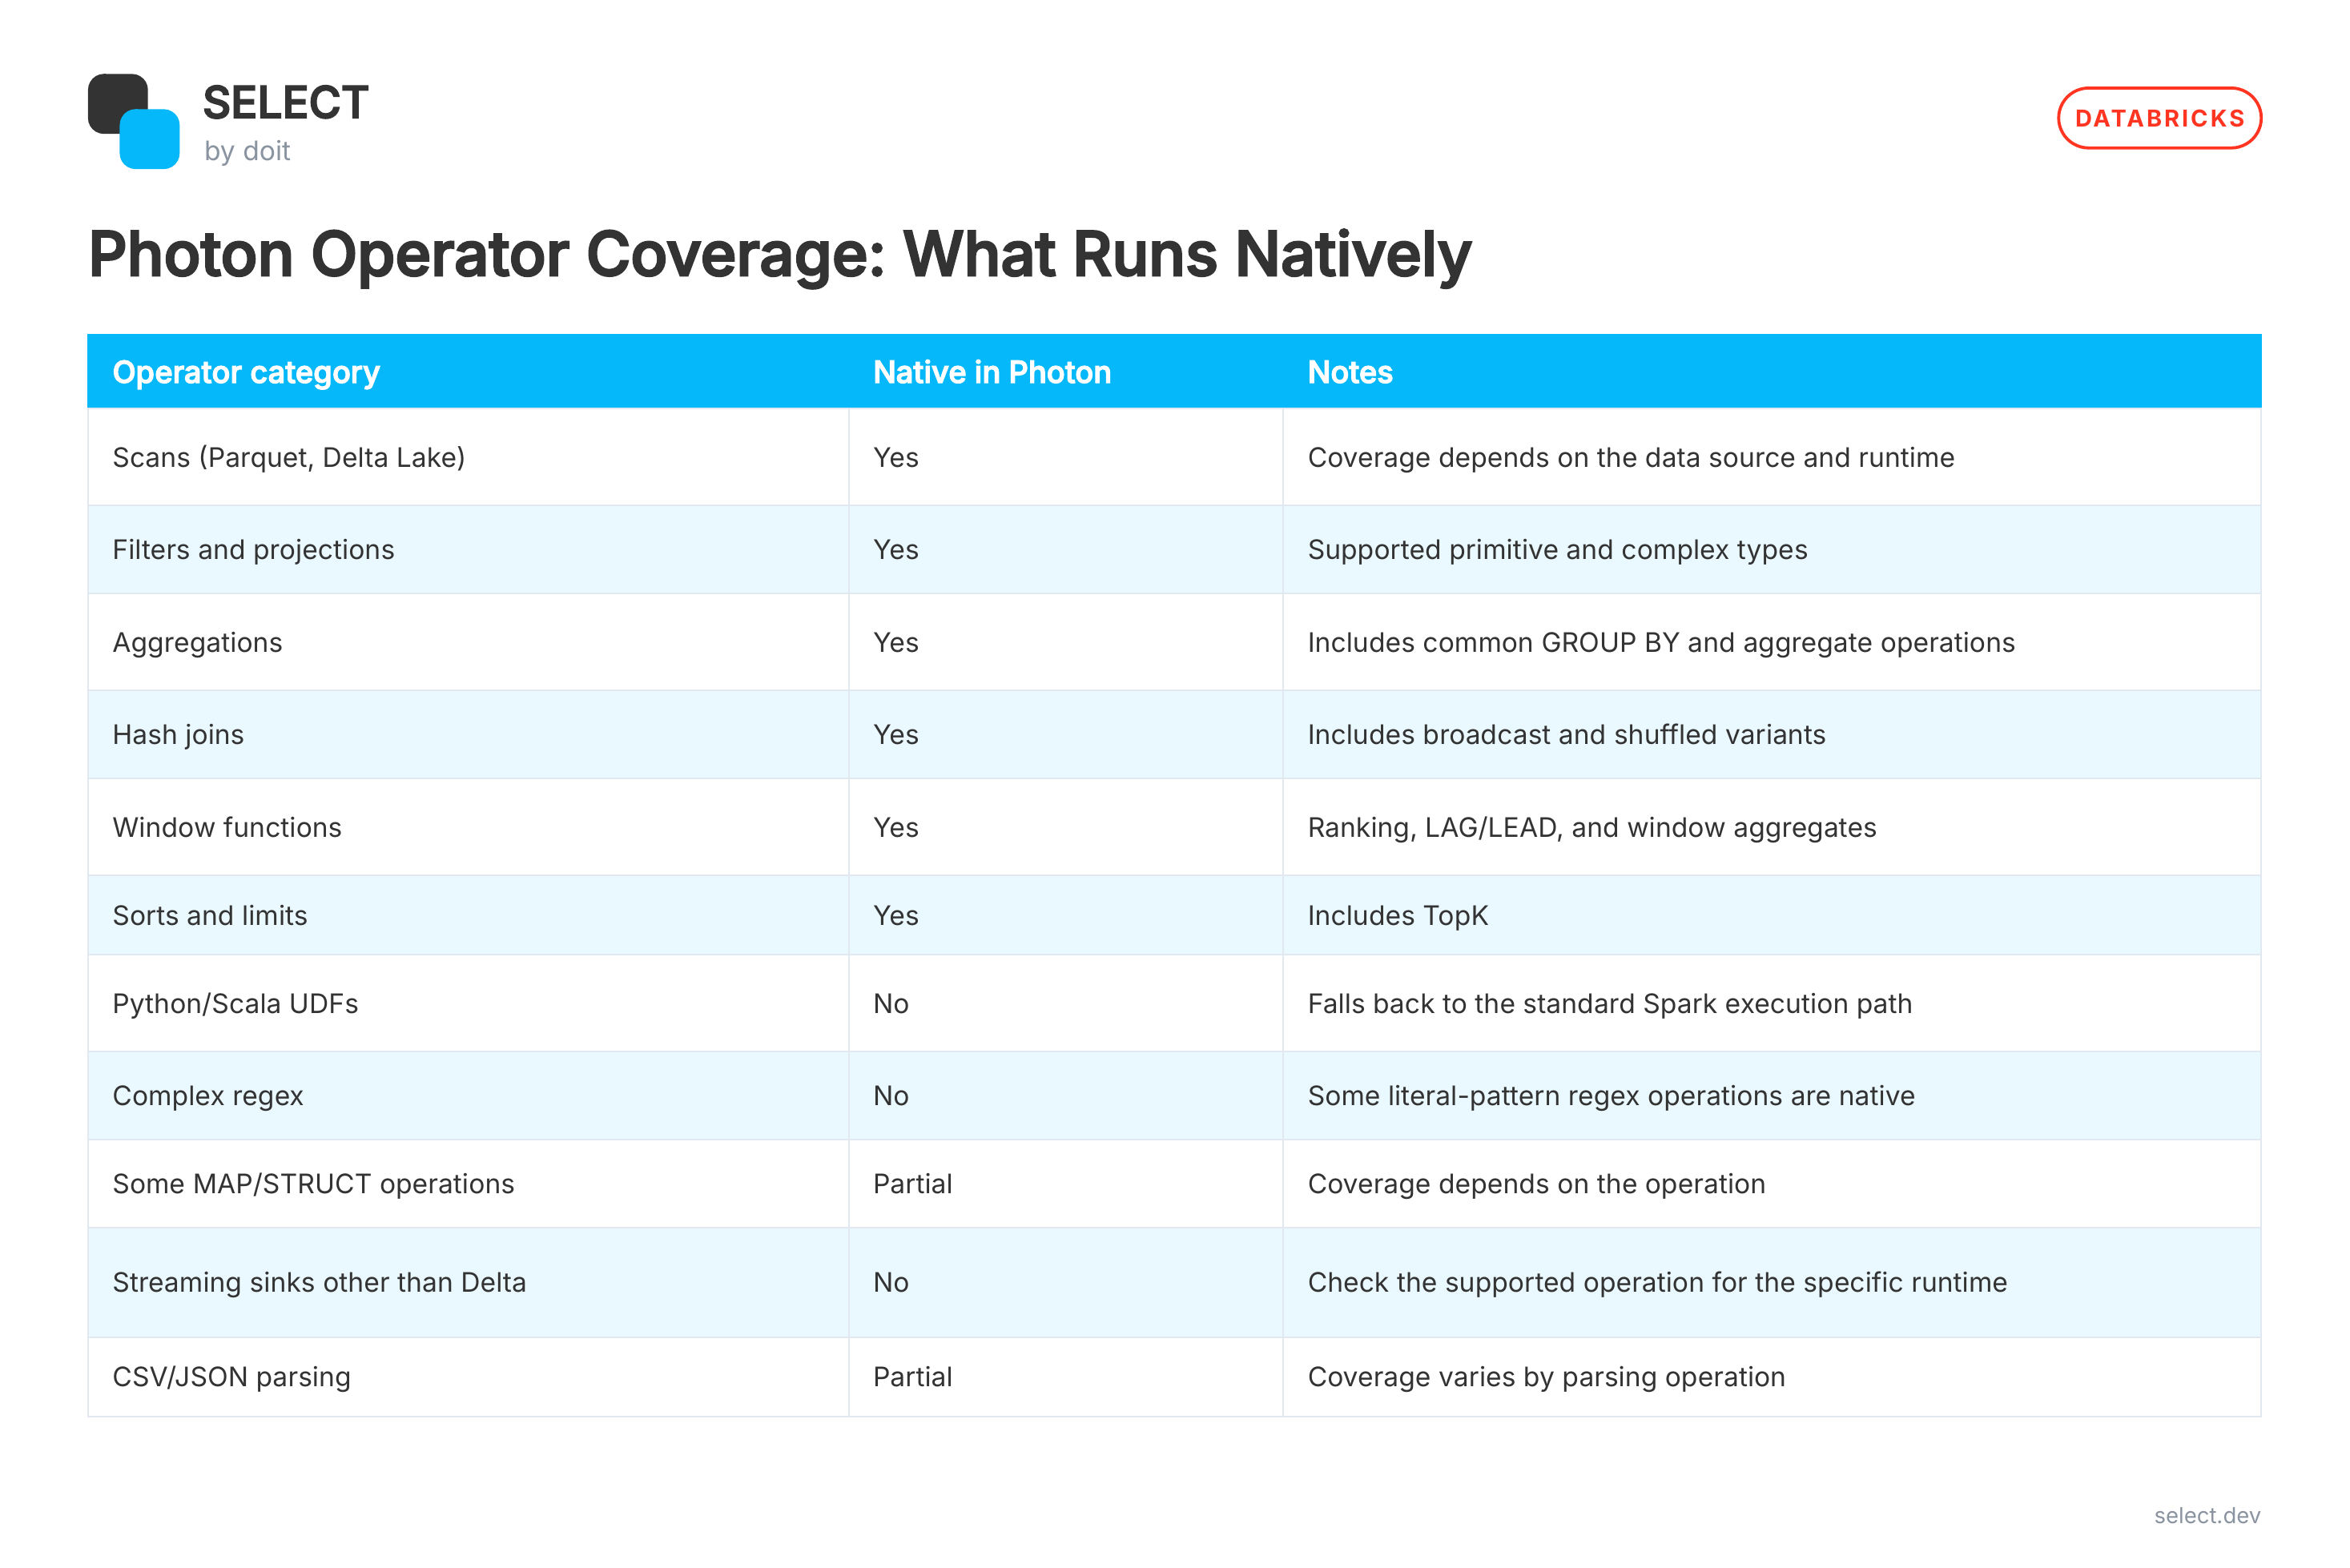
The query profile and physical plan show what happened on your own job. Find the operators consuming the most runtime, then check whether they ran through Photon or fell back. That's the evidence you need to tell whether Photon actually helped.
How Photon behaves across compute surfaces
Where you run the workload changes how Photon is configured and how the bill works. That matters when the same job moves between a classic cluster, a SQL warehouse, and serverless and suddenly the numbers don't line up.
With Databricks SQL warehouses, Photon is on by default on the Classic tier. Pro and Serverless tiers are Photon-only. So if you're running SQL analytics, there isn't much value in asking whether Photon is enabled. The better question is what the query profile says and whether the work Photon is actually doing is enough to justify the compute.
How to enable Photon on classic clusters
On classic clusters, Photon is enabled by default for all-purpose and jobs compute, and the Use Photon Acceleration setting turns it off. If you're creating compute through the API, you can set runtime_engine: "PHOTON" explicitly. The instance type still needs to support Photon.
The 2× DBU comparison from earlier is especially useful on classic clusters. If you're trying to understand what Photon is doing to a recurring ETL job, run the same workload on the same instance type with and without Photon. Look at both runtime and DBUs. A faster job is only interesting if it gets fast enough to pay for the higher rate.
Photon on serverless compute
On serverless compute, Photon is enabled by default, but you do not manage a cluster, choose the VM family, or toggle the runtime. Databricks handles that layer for you. The catch is that serverless uses a different pricing model, so the 2× classic-cluster calculation does not carry over directly. Lakebase runs on that same serverless model, worth keeping in mind if you're pricing it alongside classic-cluster Photon workloads; the pricing structures aren't the same.
The pricing difference matters when workloads move between compute surfaces. The engine can stay the same while the economics change underneath it. If a job is cheap on a Photon-enabled classic cluster, that doesn't mean moving it to serverless will produce the same cost profile. The compute surface is part of the calculation. If you're working through that calculation across your Databricks environment, Databricks Cost Optimization covers the other levers, from auto-termination and compute sizing to table layout and governance.
Reading the query profile to measure Photon coverage
If you want to know whether Photon actually improved performance, start with the query profile, not elapsed time. The profile shows where the workload spent its time and which parts of the plan used the engine.
A workload can finish sooner and still tell you very little about the economics. If most of the task time went to Photon-native scans, joins, or aggregations, the speedup has a clear explanation. If the expensive operators fell back to the standard execution path, or most of the time went into shuffle and I/O, the engine isn't doing much for the part that matters.
Here's what that looks like in the query profile:
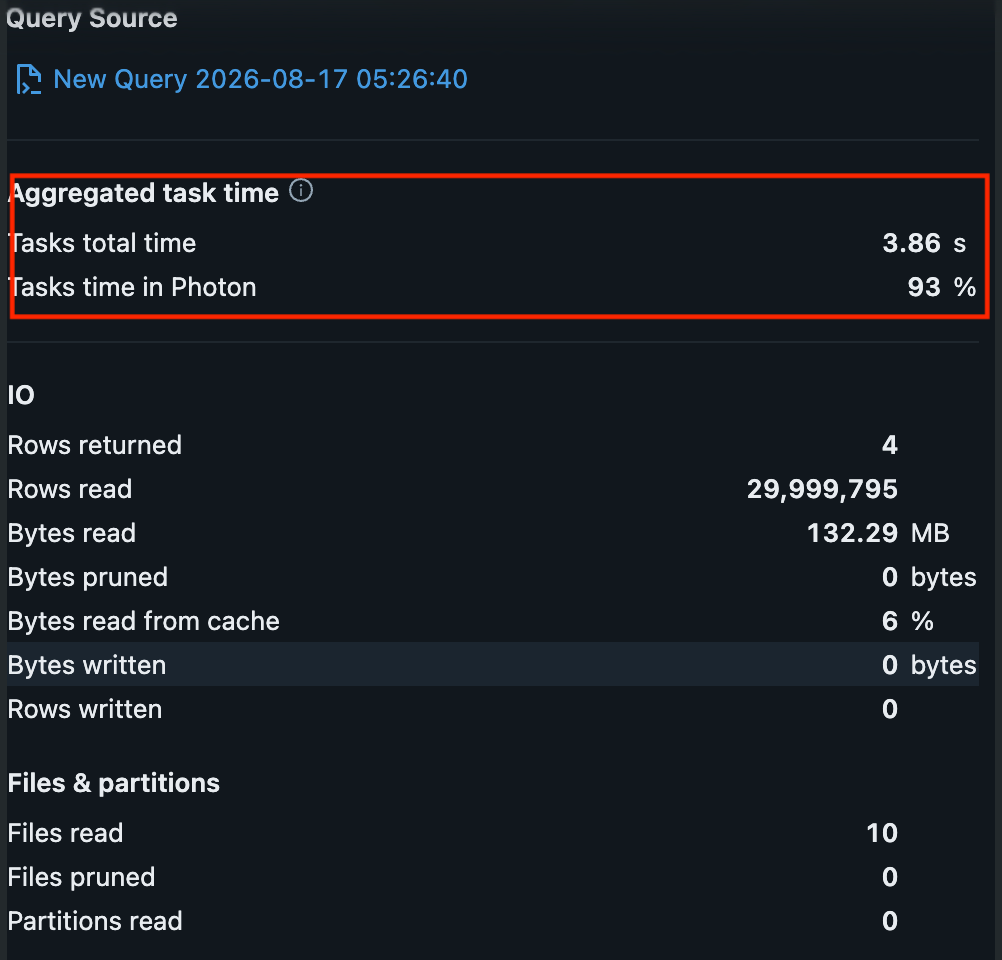
In this example, 93% of task time went through Photon. The query read 29,999,795 rows across 10 files, with 3.86 seconds of total task time. That's a strong signal that Photon handled most of the task execution.
The important number isn't just the percentage. Look at what the query was actually doing alongside it. That 93% result is a clean win because the expensive operators, the scan and the aggregation, both ran natively. It won't always look that clean. Say a different query spends 70% of its time in a Python UDF or waiting on a wide shuffle. Turning Photon on there doesn't touch the actual bottleneck, no matter how the runtime looks afterward. The percentage only tells you something once you know what it's measuring.
That's also where the operator coverage from the last section pays off: not counting how many operators use Photon, but finding where the task time actually went.
This is also how you explain surprising results after the fact. A job can show a meaningful runtime improvement while most of the expensive work sits outside Photon. Another can get a larger gain because its biggest operators run natively. Same runtime metric, different reasons underneath, and the profile is what tells you which one you're looking at.
For recurring ETL and SQL workloads, this is the check to run before deciding whether Photon earns its DBUs: find the expensive operators, see which path they took, then connect that back to runtime and cost.
Measuring Photon cost with SELECT
A faster Photon workload isn't automatically a cheaper one. You need to connect the runtime improvement to the DBUs and infrastructure cost before calling it a win.
SELECT lets you trace Databricks spend back to jobs, clusters, and warehouses, with DBU consumption and underlying infrastructure costs in the same view. For a recurring ETL job, compare equivalent runs before and after the Photon change. Compare performance, DBUs, and total cost together. If the job finishes faster but the higher Photon rate pushes cost up, the speedup didn't pay for itself. The same attribution covers AI model serving costs in Agent Bricks if Photon is only one piece of a larger workload.
The 2x DBU rate from earlier gives you the baseline. A classic-cluster workload needs roughly a 2x speedup to break even. SELECT gives you the job-level usage and cost data to see where your workload actually lands instead of estimating from runtime alone.
The query profile shows where the engine helped. SELECT shows the DBUs and infrastructure cost behind that improvement. Together, they show whether a recurring ETL or SQL workload is getting cheaper as it gets faster. Book a demo to run that comparison against your own Photon-enabled jobs.
Frequently asked questions
Does Photon work with my existing Spark code?
Yes. Photon runs underneath the same Spark programming model, so you don't need to rewrite your Spark jobs to use it. Your existing DataFrame and SQL workloads can use Photon when their physical plan maps to supported native operators. The main thing to check is operator coverage, especially if your pipeline relies heavily on UDFs or other operations that fall back to the standard Spark execution path.
Why are my Python UDFs not faster with Photon enabled?
Because Photon doesn't execute arbitrary Python UDFs natively, the UDF runs through the standard Spark and Python execution path, so Photon can't optimize the Python code itself. If the UDF is your bottleneck, enabling Photon won't change much. Where possible, replace the UDF with a built-in SQL function. If a Python UDF is unavoidable, a pandas_udf can reduce some Python/JVM overhead, but it doesn't make the UDF Photon-native.
How do I check what percentage of my query ran on Photon?
Open the completed query profile and go to Aggregated task time → Tasks time in Photon. That percentage tells you how much task time went through Photon. Then check the operator breakdown to see where the remaining time went. The percentage alone isn't enough. You also need to know whether Photon handled the expensive part of the workload.
Does Photon cost more than standard Databricks Runtime?
On classic clusters, yes. Photon-enabled compute has a higher DBU rate than equivalent non-Photon compute. The exact multiplier depends on the instance type, but roughly 2× is the useful number for the cost calculation. That means the workload needs roughly a 2× speedup to break even.
Does Photon support GPU acceleration?
No. Photon is a CPU-based native execution engine, not a GPU execution engine. It accelerates supported Spark operations using native CPU execution. If your workload requires GPU compute for machine learning or another GPU-specific workload, Photon doesn't replace GPU-enabled compute.
Ian is the Co-founder & CEO of SELECT, a SaaS Snowflake cost management and optimization platform. Prior to starting SELECT, Ian spent 6 years leading full stack data science & engineering teams at Shopify and Capital One. At Shopify, Ian led the efforts to optimize their data warehouse and increase cost observability.
Want to hear about our latest data cloud learnings?Subscribe to get notified.
Get up and running in less than 15 minutes
Connect your Snowflake, Databricks, or BigQuery account and instantly understand your savings potential.