

← Back
Understanding period over period changes
Thursday, December 07, 2023
 Niall WoodwardCo-founder & CTO of SELECT
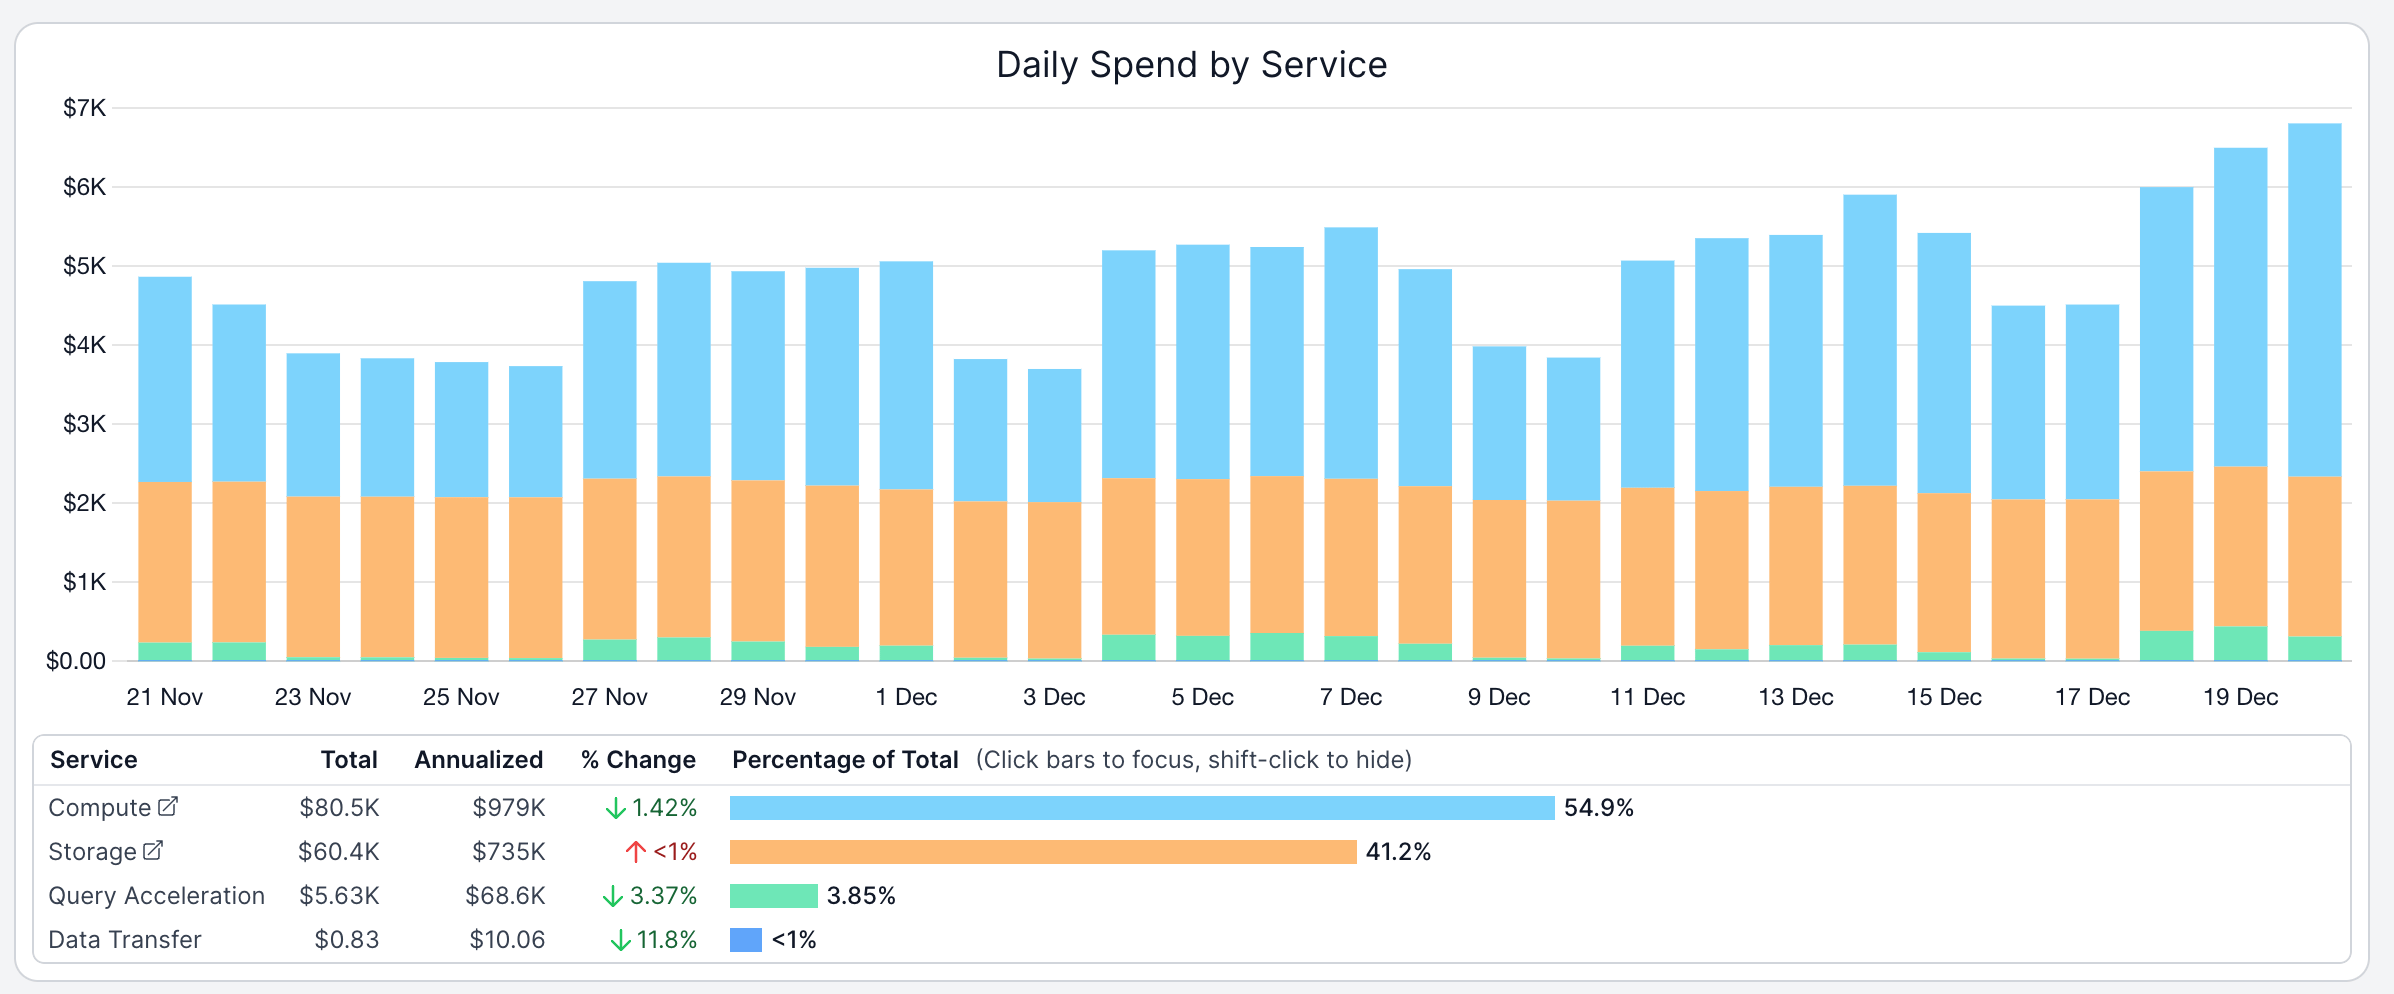
To help you more easily understand how your consumption has changed, we've added a new % Change column to all tables below each chart. This allows you to quickly identify how resources have changed in a given period.
The example below shows Snowflake spend between November 21 and December 20. In this example, Compute spend decreased by 1.42% relative to the previous 30 day period (October 21 to November 20).
Up next.Previous Changelog Entries.