

Hourly granularity now available in all timeseries plots
Tuesday, June 20, 2023
 Niall WoodwardCo-founder & CTO of SELECT
Data warehouse workloads often follow specific patterns based on the time of day or week. A surge of queries every Monday morning at 9AM, decreased usage on weekends, or a spike over a few hours as an expensive backfill is run. To help Snowflake users better understand their usage, we've added the ability for all timeseries plots to be viewed at the hourly level.
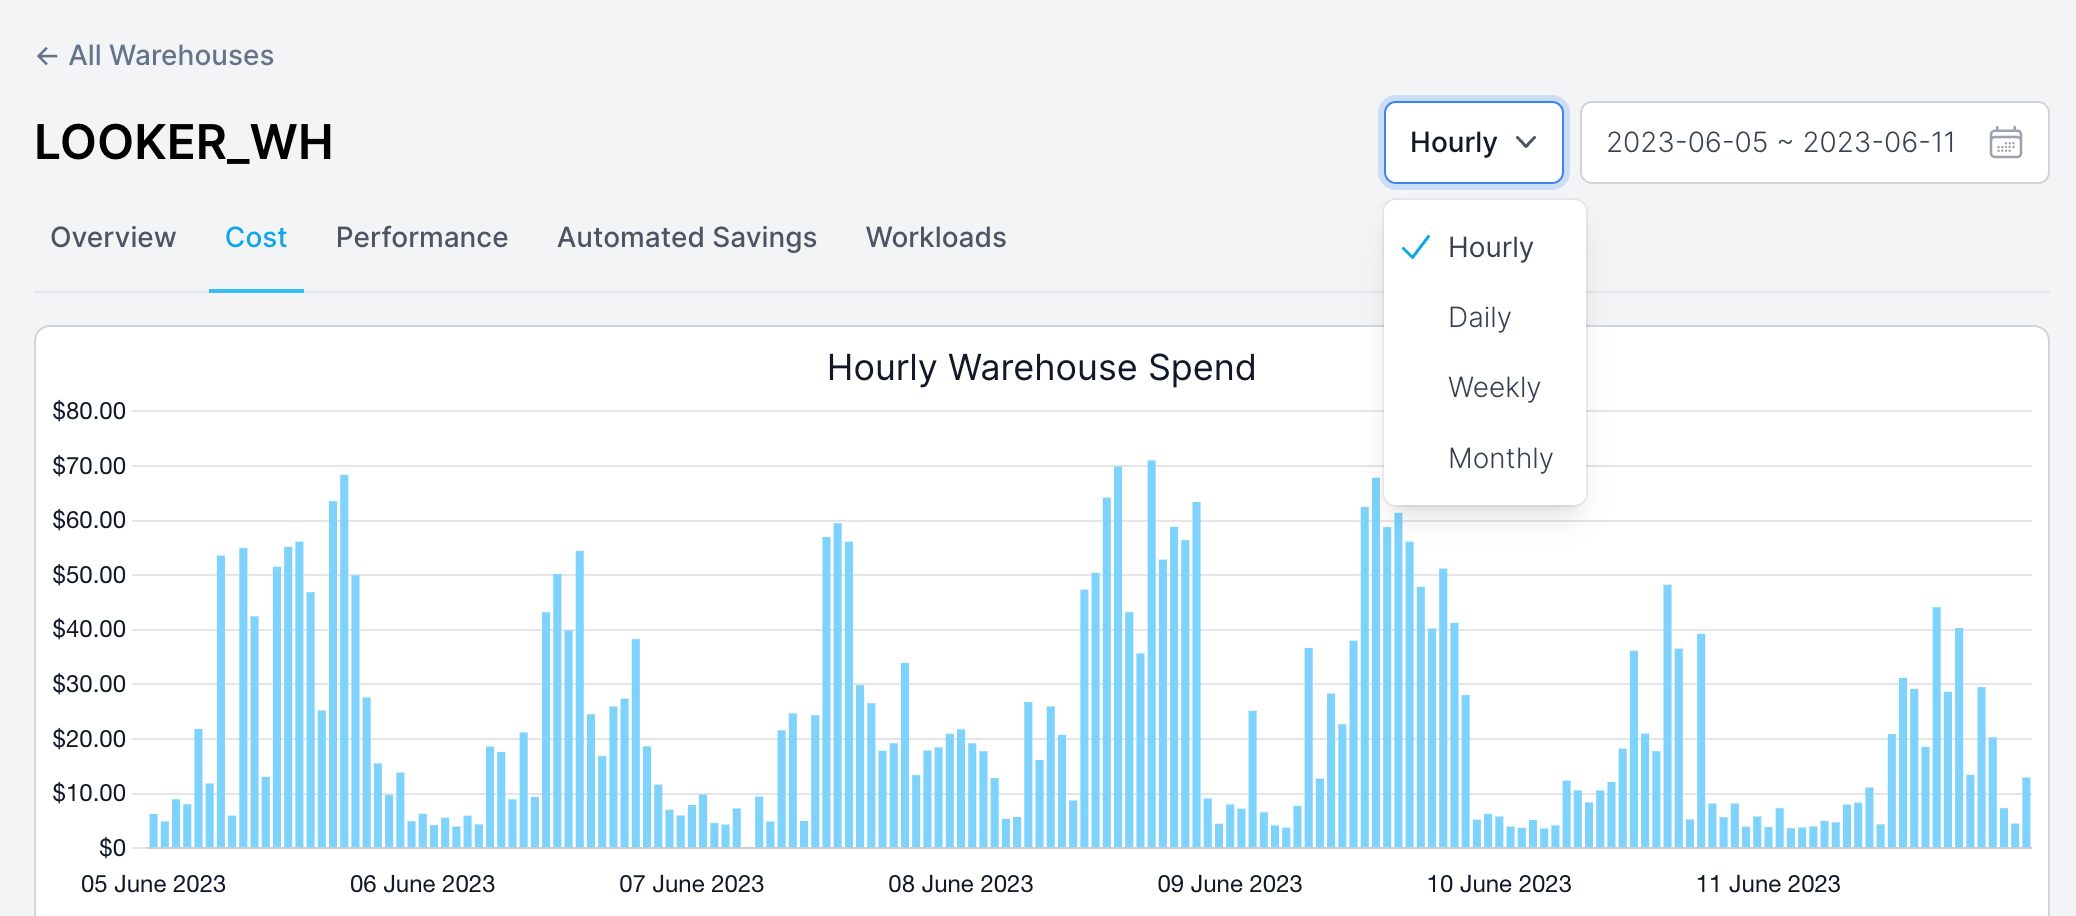
By analyzing trends at a more granular level, users can more easily understand their usage and identify optimization opportunities. Take this reporting warehouse as an example. There's a fairly consistent pattern of the warehosue utilization dropping below 10% every night, presenting a great opportunity for scheduled downsizing.

Up next.Previous Changelog Entries.